
 Yahoo Finance
 Returns At SKY Network Television (NZSE:SKT) Appear To Be Weighed Down
Did you know there are some financial metrics that can provide clues of a potential multi-bagger? In a perfect world, we'd like to see a company investing more capital into its business and ideally the returns earned from that capital are also increasing. Ultimately, this demonstrates that it's a business that is reinvesting profits at increasing rates of return. Having said that, from a first glance at SKY Network Television (NZSE:SKT) we aren't jumping out of our chairs at how returns are trending, but let's have a deeper look.
Understanding Return On Capital Employed (ROCE)
If you haven't worked with ROCE before, it measures the 'return' (pre-tax profit) a company generates from capital employed in its business. The formula for this calculation on SKY Network Television is:
Return on Capital Employed = Earnings Before Interest and Tax (EBIT) ÷ (Total Assets - Current Liabilities)
0.17 = NZ$77m ÷ (NZ$702m - NZ$239m) (Based on the trailing twelve months to June 2021).
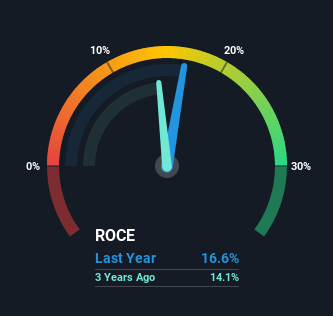
So, SKY Network Television has an ROCE of 17%. In absolute terms, that's a satisfactory return, but compared to the Media industry average of 11% it's much better.
See our latest analysis for SKY Network Television
Above you can see how the current ROCE for SKY Network Television compares to its prior returns on capital, but there's only so much you can tell from the past. If you'd like to see what analysts are forecasting going forward, you should check out our free report for SKY Network Television.
The Trend Of ROCE
Over the past five years, SKY Network Television's ROCE has remained relatively flat while the business is using 70% less capital than before. When a company effectively decreases its assets base, it's not usually a sign to be optimistic on that company. So if this trend continues, don't be surprised if the business is smaller in a few years time.
Another point to note, we noticed the company has increased current liabilities over the last five years. This is intriguing because if current liabilities hadn't increased to 34% of total assets, this reported ROCE would probably be less than17% because total capital employed would be higher.The 17% ROCE could be even lower if current liabilities weren't 34% of total assets, because the the formula would show a larger base of total capital employed. With that in mind, just be wary if this ratio increases in the future, because if it gets particularly high, this brings with it some new elements of risk.
The Bottom Line
In summary, SKY Network Television isn't reinvesting funds back into the business and returns aren't growing. Moreover, since the stock has crumbled 84% over the last five years, it appears investors are expecting the worst. On the whole, we aren't too inspired by the underlying trends and we think there may be better chances of finding a multi-bagger elsewhere.
One more thing, we've spotted 1 warning sign facing SKY Network Television that you might find interesting.
If you want to search for solid companies with great earnings, check out this free list of companies with good balance sheets and impressive returns on equity.
Have feedback on this article? Concerned about the content? Get in touch with us directly. Alternatively, email editorial-team (at) simplywallst.com.
This article by Simply Wall St is general in nature. We provide commentary based on historical data and analyst forecasts only using an unbiased methodology and our articles are not intended to be financial advice. It does not constitute a recommendation to buy or sell any stock, and does not take account of your objectives, or your financial situation. We aim to bring you long-term focused analysis driven by fundamental data. Note that our analysis may not factor in the latest price-sensitive company announcements or qualitative material. Simply Wall St has no position in any stocks mentioned.
