
 Yahoo Finance
 Returns At Wilhelmina International (NASDAQ:WHLM) Are On The Way Up
Did you know there are some financial metrics that can provide clues of a potential multi-bagger? Ideally, a business will show two trends; firstly a growing return on capital employed (ROCE) and secondly, an increasing amount of capital employed. Put simply, these types of businesses are compounding machines, meaning they are continually reinvesting their earnings at ever-higher rates of return. So on that note, Wilhelmina International (NASDAQ:WHLM) looks quite promising in regards to its trends of return on capital.
Understanding Return On Capital Employed (ROCE)
If you haven't worked with ROCE before, it measures the 'return' (pre-tax profit) a company generates from capital employed in its business. To calculate this metric for Wilhelmina International, this is the formula:
Return on Capital Employed = Earnings Before Interest and Tax (EBIT) ÷ (Total Assets - Current Liabilities)
0.11 = US$2.7m ÷ (US$40m - US$14m) (Based on the trailing twelve months to September 2022).
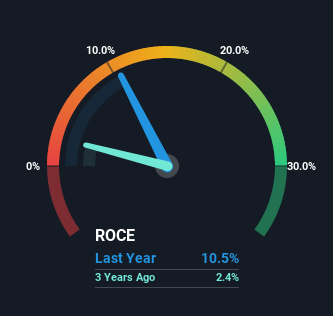
So, Wilhelmina International has an ROCE of 11%. In absolute terms, that's a pretty normal return, and it's somewhat close to the Commercial Services industry average of 9.3%.
Check out our latest analysis for Wilhelmina International
While the past is not representative of the future, it can be helpful to know how a company has performed historically, which is why we have this chart above. If you want to delve into the historical earnings, revenue and cash flow of Wilhelmina International, check out these free graphs here.
What Does the ROCE Trend For Wilhelmina International Tell Us?
Shareholders will be relieved that Wilhelmina International has broken into profitability. While the business was unprofitable in the past, it's now turned things around and is earning 11% on its capital. On top of that, what's interesting is that the amount of capital being employed has remained steady, so the business hasn't needed to put any additional money to work to generate these higher returns. With no noticeable increase in capital employed, it's worth knowing what the company plans on doing going forward in regards to reinvesting and growing the business. So if you're looking for high growth, you'll want to see a business's capital employed also increasing.
The Key Takeaway
To sum it up, Wilhelmina International is collecting higher returns from the same amount of capital, and that's impressive. Astute investors may have an opportunity here because the stock has declined 44% in the last five years. So researching this company further and determining whether or not these trends will continue seems justified.
If you want to continue researching Wilhelmina International, you might be interested to know about the 3 warning signs that our analysis has discovered.
For those who like to invest in solid companies, check out this free list of companies with solid balance sheets and high returns on equity.
Have feedback on this article? Concerned about the content? Get in touch with us directly. Alternatively, email editorial-team (at) simplywallst.com.
This article by Simply Wall St is general in nature. We provide commentary based on historical data and analyst forecasts only using an unbiased methodology and our articles are not intended to be financial advice. It does not constitute a recommendation to buy or sell any stock, and does not take account of your objectives, or your financial situation. We aim to bring you long-term focused analysis driven by fundamental data. Note that our analysis may not factor in the latest price-sensitive company announcements or qualitative material. Simply Wall St has no position in any stocks mentioned.
Join A Paid User Research Session
You’ll receive a US$30 Amazon Gift card for 1 hour of your time while helping us build better investing tools for the individual investors like yourself. Sign up here
