
 Yahoo Finance
 Rightmove (LON:RMV) jumps 6.1% this week, though earnings growth is still tracking behind five-year shareholder returns
Generally speaking the aim of active stock picking is to find companies that provide returns that are superior to the market average. And the truth is, you can make significant gains if you buy good quality businesses at the right price. To wit, the Rightmove share price has climbed 29% in five years, easily topping the market decline of 1.0% (ignoring dividends).
Since it's been a strong week for Rightmove shareholders, let's have a look at trend of the longer term fundamentals.
See our latest analysis for Rightmove
While markets are a powerful pricing mechanism, share prices reflect investor sentiment, not just underlying business performance. One imperfect but simple way to consider how the market perception of a company has shifted is to compare the change in the earnings per share (EPS) with the share price movement.
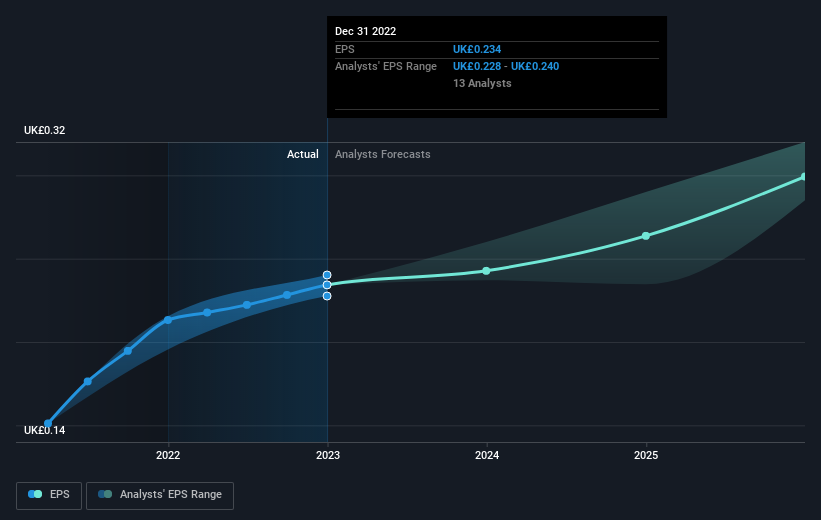
Over half a decade, Rightmove managed to grow its earnings per share at 8.8% a year. This EPS growth is higher than the 5% average annual increase in the share price. So one could conclude that the broader market has become more cautious towards the stock.
The image below shows how EPS has tracked over time (if you click on the image you can see greater detail).
It might be well worthwhile taking a look at our free report on Rightmove's earnings, revenue and cash flow.
What About Dividends?
It is important to consider the total shareholder return, as well as the share price return, for any given stock. Whereas the share price return only reflects the change in the share price, the TSR includes the value of dividends (assuming they were reinvested) and the benefit of any discounted capital raising or spin-off. Arguably, the TSR gives a more comprehensive picture of the return generated by a stock. As it happens, Rightmove's TSR for the last 5 years was 36%, which exceeds the share price return mentioned earlier. The dividends paid by the company have thusly boosted the total shareholder return.
A Different Perspective
While the broader market gained around 1.2% in the last year, Rightmove shareholders lost 7.6% (even including dividends). However, keep in mind that even the best stocks will sometimes underperform the market over a twelve month period. On the bright side, long term shareholders have made money, with a gain of 6% per year over half a decade. If the fundamental data continues to indicate long term sustainable growth, the current sell-off could be an opportunity worth considering. Is Rightmove cheap compared to other companies? These 3 valuation measures might help you decide.
If you are like me, then you will not want to miss this free list of growing companies that insiders are buying.
Please note, the market returns quoted in this article reflect the market weighted average returns of stocks that currently trade on British exchanges.
Have feedback on this article? Concerned about the content? Get in touch with us directly. Alternatively, email editorial-team (at) simplywallst.com.
This article by Simply Wall St is general in nature. We provide commentary based on historical data and analyst forecasts only using an unbiased methodology and our articles are not intended to be financial advice. It does not constitute a recommendation to buy or sell any stock, and does not take account of your objectives, or your financial situation. We aim to bring you long-term focused analysis driven by fundamental data. Note that our analysis may not factor in the latest price-sensitive company announcements or qualitative material. Simply Wall St has no position in any stocks mentioned.
Join A Paid User Research Session
You’ll receive a US$30 Amazon Gift card for 1 hour of your time while helping us build better investing tools for the individual investors like yourself. Sign up here
