
 Yahoo Finance
 Rocket Lab USA (NASDAQ:RKLB shareholders incur further losses as stock declines 3.9% this week, taking one-year losses to 41%
Rocket Lab USA, Inc. (NASDAQ:RKLB) shareholders will doubtless be very grateful to see the share price up 32% in the last month. But that doesn't change the reality of under-performance over the last twelve months. The cold reality is that the stock has dropped 41% in one year, under-performing the market.
Given the past week has been tough on shareholders, let's investigate the fundamentals and see what we can learn.
View our latest analysis for Rocket Lab USA
Rocket Lab USA isn't currently profitable, so most analysts would look to revenue growth to get an idea of how fast the underlying business is growing. Generally speaking, companies without profits are expected to grow revenue every year, and at a good clip. As you can imagine, fast revenue growth, when maintained, often leads to fast profit growth.
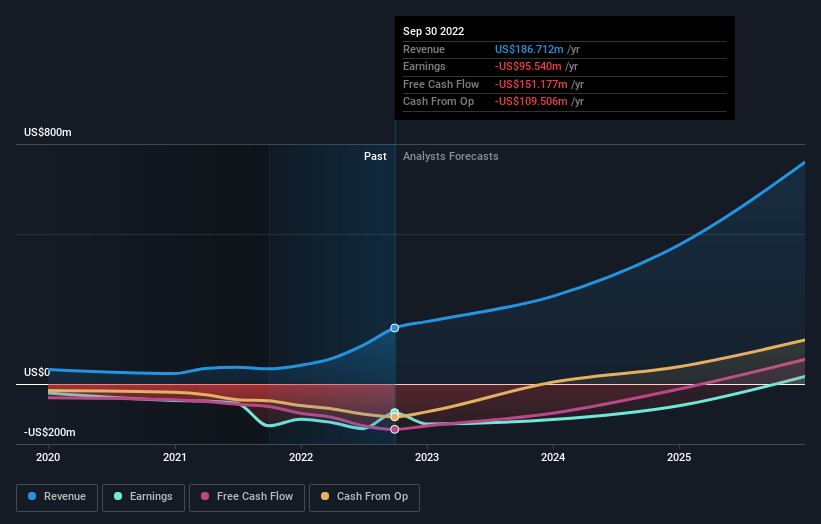
In the last year Rocket Lab USA saw its revenue grow by 270%. That's well above most other pre-profit companies. Given the revenue growth, the share price drop of 41% seems quite harsh. Our sympathies to shareholders who are now underwater. Prima facie, revenue growth like that should be a good thing, so it's worth checking whether losses have stabilized. Our brains have evolved to think in linear fashion, so there's value in learning to recognize exponential growth. We are, in some ways, simply the wisest of the monkeys.
You can see how earnings and revenue have changed over time in the image below (click on the chart to see the exact values).
We're pleased to report that the CEO is remunerated more modestly than most CEOs at similarly capitalized companies. But while CEO remuneration is always worth checking, the really important question is whether the company can grow earnings going forward. If you are thinking of buying or selling Rocket Lab USA stock, you should check out this free report showing analyst profit forecasts.
A Different Perspective
Rocket Lab USA shareholders are down 41% for the year, even worse than the market loss of 7.9%. That's disappointing, but it's worth keeping in mind that the market-wide selling wouldn't have helped. It's great to see a nice little 3.8% rebound in the last three months. This could just be a bounce because the selling was too aggressive, but fingers crossed it's the start of a new trend. I find it very interesting to look at share price over the long term as a proxy for business performance. But to truly gain insight, we need to consider other information, too. For example, we've discovered 2 warning signs for Rocket Lab USA that you should be aware of before investing here.
But note: Rocket Lab USA may not be the best stock to buy. So take a peek at this free list of interesting companies with past earnings growth (and further growth forecast).
Please note, the market returns quoted in this article reflect the market weighted average returns of stocks that currently trade on US exchanges.
Have feedback on this article? Concerned about the content? Get in touch with us directly. Alternatively, email editorial-team (at) simplywallst.com.
This article by Simply Wall St is general in nature. We provide commentary based on historical data and analyst forecasts only using an unbiased methodology and our articles are not intended to be financial advice. It does not constitute a recommendation to buy or sell any stock, and does not take account of your objectives, or your financial situation. We aim to bring you long-term focused analysis driven by fundamental data. Note that our analysis may not factor in the latest price-sensitive company announcements or qualitative material. Simply Wall St has no position in any stocks mentioned.
Join A Paid User Research Session
You’ll receive a US$30 Amazon Gift card for 1 hour of your time while helping us build better investing tools for the individual investors like yourself. Sign up here
