
 Yahoo Finance
 Can Ryman Healthcare Limited (NZE:RYM) Continue To Outperform Its Industry?

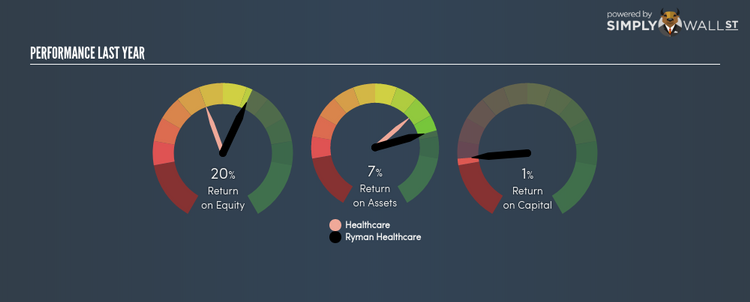
Ryman Healthcare Limited (NZSE:RYM) delivered an ROE of 20.01% over the past 12 months, which is an impressive feat relative to its industry average of 12.81% during the same period. On the surface, this looks fantastic since we know that RYM has made large profits from little equity capital; however, ROE doesn’t tell us if management have borrowed heavily to make this happen. In this article, we’ll closely examine some factors like financial leverage to evaluate the sustainability of RYM’s ROE. See our latest analysis for Ryman Healthcare
Peeling the layers of ROE – trisecting a company’s profitability
Return on Equity (ROE) weighs Ryman Healthcare’s profit against the level of its shareholders’ equity. It essentially shows how much the company can generate in earnings given the amount of equity it has raised. While a higher ROE is preferred in most cases, there are several other factors we should consider before drawing any conclusions.
Return on Equity = Net Profit ÷ Shareholders Equity
ROE is measured against cost of equity in order to determine the efficiency of Ryman Healthcare’s equity capital deployed. Its cost of equity is 5.07%. Since Ryman Healthcare’s return covers its cost in excess of 14.93%, its use of equity capital is efficient and likely to be sustainable. Simply put, Ryman Healthcare pays less for its capital than what it generates in return. ROE can be dissected into three distinct ratios: net profit margin, asset turnover, and financial leverage. This is called the Dupont Formula:
Dupont Formula
ROE = profit margin × asset turnover × financial leverage
ROE = (annual net profit ÷ sales) × (sales ÷ assets) × (assets ÷ shareholders’ equity)
ROE = annual net profit ÷ shareholders’ equity
The first component is profit margin, which measures how much of sales is retained after the company pays for all its expenses. Asset turnover reveals how much revenue can be generated from Ryman Healthcare’s asset base. Finally, financial leverage will be our main focus today. It shows how much of assets are funded by equity and can show how sustainable the company’s capital structure is. Since financial leverage can artificially inflate ROE, we need to look at how much debt Ryman Healthcare currently has. Currently the debt-to-equity ratio stands at a reasonable 55.07%, which means its above-average ROE is driven by its ability to grow its profit without a significant debt burden.

Next Steps:
While ROE is a relatively simple calculation, it can be broken down into different ratios, each telling a different story about the strengths and weaknesses of a company. Ryman Healthcare’s above-industry ROE is encouraging, and is also in excess of its cost of equity. Its high ROE is not likely to be driven by high debt. Therefore, investors may have more confidence in the sustainability of this level of returns going forward. ROE is a helpful signal, but it is definitely not sufficient on its own to make an investment decision.
For Ryman Healthcare, I’ve put together three important aspects you should look at:
Financial Health: Does it have a healthy balance sheet? Take a look at our free balance sheet analysis with six simple checks on key factors like leverage and risk.
Future Earnings: How does Ryman Healthcare’s growth rate compare to its peers and the wider market? Dig deeper into the analyst consensus number for the upcoming years by interacting with our free analyst growth expectation chart.
Other High-Growth Alternatives : Are there other high-growth stocks you could be holding instead of Ryman Healthcare? Explore our interactive list of stocks with large growth potential to get an idea of what else is out there you may be missing!
To help readers see pass the short term volatility of the financial market, we aim to bring you a long-term focused research analysis purely driven by fundamental data. Note that our analysis does not factor in the latest price sensitive company announcements.
The author is an independent contributor and at the time of publication had no position in the stocks mentioned.
