
 Yahoo Finance
 How Sabre Insurance Group plc’s (LON:SBRE) Earnings Growth Stacks Up Against The Industry

After looking at Sabre Insurance Group plc’s (LON:SBRE) latest earnings announcement (30 June 2018), I found it useful to revisit the company’s performance in the past couple of years and assess this against the most recent figures. As a long-term investor I tend to focus on earnings trend, rather than a single number at one point in time. Also, comparing it against an industry benchmark to understand whether it outperformed, or is simply riding an industry wave, is a crucial aspect. Below is a brief commentary on my key takeaways.
See our latest analysis for Sabre Insurance Group
How Well Did SBRE Perform?
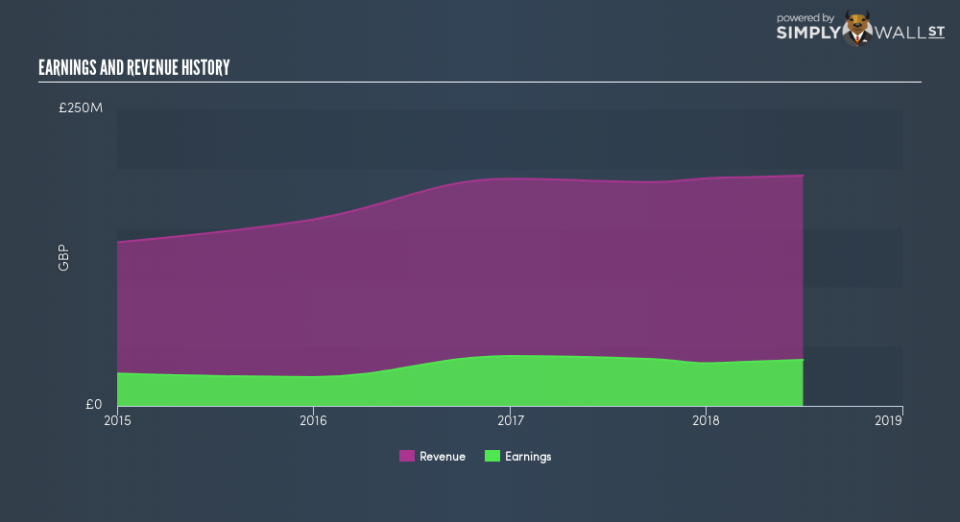
SBRE’s trailing twelve-month earnings (from 30 June 2018) of UK£38.75m has declined by -3.71% compared to the previous year. Furthermore, this one-year growth rate has been lower than its average earnings growth rate over the past 5 years of 11.07%, indicating the rate at which SBRE is growing has slowed down. Why could this be happening? Let’s examine what’s going on with margins and if the rest of the industry is experiencing the hit as well.
In the last couple of years, revenue growth has not been able to catch up, which implies that Sabre Insurance Group’s bottom line has been driven by unsustainable cost-cutting. Eyeballing growth from a sector-level, the UK insurance industry has been growing, albeit, at a muted single-digit rate of 3.07% over the previous twelve months, and a substantial 10.08% over the past half a decade. This growth is a median of profitable companies of 21 Insurance companies in GB including Beazley, Hiscox and GBGI. This means that any near-term headwind the industry is enduring, it’s hitting Sabre Insurance Group harder than its peers.
In terms of returns from investment, Sabre Insurance Group has fallen short of achieving a 20% return on equity (ROE), recording 18.63% instead. However, its return on assets (ROA) of 6.28% exceeds the GB Insurance industry of 1.30%, indicating Sabre Insurance Group has used its assets more efficiently. And finally, its return on capital (ROC), which also accounts for Sabre Insurance Group’s debt level, has increased over the past 3 years from 20.62% to 25.96%.
What does this mean?
Though Sabre Insurance Group’s past data is helpful, it is only one aspect of my investment thesis. Companies that are profitable, but have capricious earnings, can have many factors impacting its business. You should continue to research Sabre Insurance Group to get a better picture of the stock by looking at:
Future Outlook: What are well-informed industry analysts predicting for SBRE’s future growth? Take a look at our free research report of analyst consensus for SBRE’s outlook.
Financial Health: Are SBRE’s operations financially sustainable? Balance sheets can be hard to analyze, which is why we’ve done it for you. Check out our financial health checks here.
Other High-Performing Stocks: Are there other stocks that provide better prospects with proven track records? Explore our free list of these great stocks here.
NB: Figures in this article are calculated using data from the trailing twelve months from 30 June 2018. This may not be consistent with full year annual report figures.
To help readers see past the short term volatility of the financial market, we aim to bring you a long-term focused research analysis purely driven by fundamental data. Note that our analysis does not factor in the latest price-sensitive company announcements.
The author is an independent contributor and at the time of publication had no position in the stocks mentioned. For errors that warrant correction please contact the editor at editorial-team@simplywallst.com.
