
 Yahoo Finance
 ScS Group (LON:SCS) shareholders have endured a 29% loss from investing in the stock a year ago
Passive investing in an index fund is a good way to ensure your own returns roughly match the overall market. While individual stocks can be big winners, plenty more fail to generate satisfactory returns. Unfortunately the ScS Group plc (LON:SCS) share price slid 33% over twelve months. That's disappointing when you consider the market declined 1.5%. However, the longer term returns haven't been so bad, with the stock down 23% in the last three years. More recently, the share price has dropped a further 9.7% in a month.
So let's have a look and see if the longer term performance of the company has been in line with the underlying business' progress.
View our latest analysis for ScS Group
To paraphrase Benjamin Graham: Over the short term the market is a voting machine, but over the long term it's a weighing machine. One flawed but reasonable way to assess how sentiment around a company has changed is to compare the earnings per share (EPS) with the share price.
Unfortunately ScS Group reported an EPS drop of 85% for the last year. This fall in the EPS is significantly worse than the 33% the share price fall. So the market may not be too worried about the EPS figure, at the moment -- or it may have expected earnings to drop faster.
The graphic below depicts how EPS has changed over time (unveil the exact values by clicking on the image).
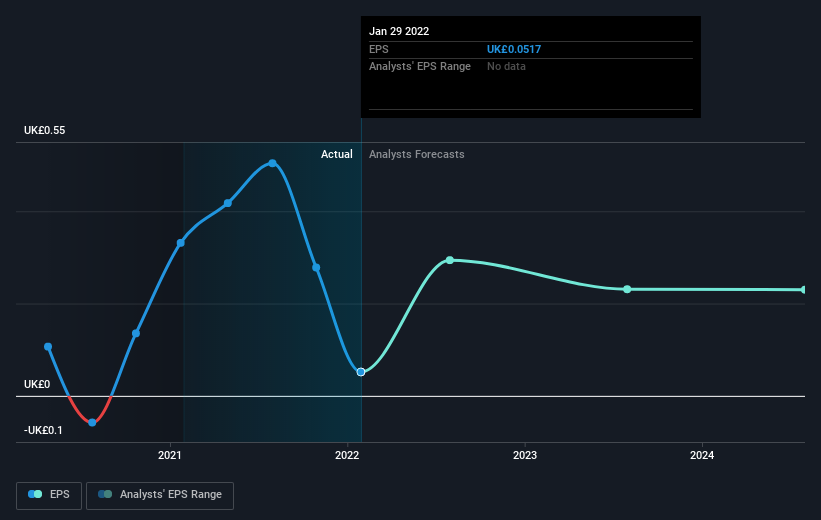
Before buying or selling a stock, we always recommend a close examination of historic growth trends, available here.
What About Dividends?
As well as measuring the share price return, investors should also consider the total shareholder return (TSR). The TSR incorporates the value of any spin-offs or discounted capital raisings, along with any dividends, based on the assumption that the dividends are reinvested. So for companies that pay a generous dividend, the TSR is often a lot higher than the share price return. As it happens, ScS Group's TSR for the last 1 year was -29%, which exceeds the share price return mentioned earlier. This is largely a result of its dividend payments!
A Different Perspective
While the broader market gained around 1.5% in the last year, ScS Group shareholders lost 29% (even including dividends). Even the share prices of good stocks drop sometimes, but we want to see improvements in the fundamental metrics of a business, before getting too interested. On the bright side, long term shareholders have made money, with a gain of 7% per year over half a decade. It could be that the recent sell-off is an opportunity, so it may be worth checking the fundamental data for signs of a long term growth trend. I find it very interesting to look at share price over the long term as a proxy for business performance. But to truly gain insight, we need to consider other information, too. Even so, be aware that ScS Group is showing 4 warning signs in our investment analysis , you should know about...
But note: ScS Group may not be the best stock to buy. So take a peek at this free list of interesting companies with past earnings growth (and further growth forecast).
Please note, the market returns quoted in this article reflect the market weighted average returns of stocks that currently trade on GB exchanges.
Have feedback on this article? Concerned about the content? Get in touch with us directly. Alternatively, email editorial-team (at) simplywallst.com.
This article by Simply Wall St is general in nature. We provide commentary based on historical data and analyst forecasts only using an unbiased methodology and our articles are not intended to be financial advice. It does not constitute a recommendation to buy or sell any stock, and does not take account of your objectives, or your financial situation. We aim to bring you long-term focused analysis driven by fundamental data. Note that our analysis may not factor in the latest price-sensitive company announcements or qualitative material. Simply Wall St has no position in any stocks mentioned.
