
 Yahoo Finance
 Some Shareholders Feeling Restless Over Menang Corporation (M) Berhad's (KLSE:MENANG) P/E Ratio
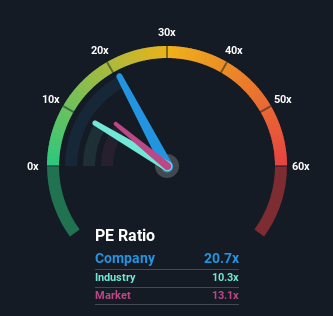
Menang Corporation (M) Berhad's (KLSE:MENANG) price-to-earnings (or "P/E") ratio of 20.7x might make it look like a strong sell right now compared to the market in Malaysia, where around half of the companies have P/E ratios below 13x and even P/E's below 7x are quite common. Although, it's not wise to just take the P/E at face value as there may be an explanation why it's so lofty.
Menang Corporation (M) Berhad has been doing a good job lately as it's been growing earnings at a solid pace. One possibility is that the P/E is high because investors think this respectable earnings growth will be enough to outperform the broader market in the near future. You'd really hope so, otherwise you're paying a pretty hefty price for no particular reason.
See our latest analysis for Menang Corporation (M) Berhad
Although there are no analyst estimates available for Menang Corporation (M) Berhad, take a look at this free data-rich visualisation to see how the company stacks up on earnings, revenue and cash flow.
Does Growth Match The High P/E?
There's an inherent assumption that a company should far outperform the market for P/E ratios like Menang Corporation (M) Berhad's to be considered reasonable.
Taking a look back first, we see that the company grew earnings per share by an impressive 28% last year. Still, EPS has barely risen at all from three years ago in total, which is not ideal. Therefore, it's fair to say that earnings growth has been inconsistent recently for the company.
This is in contrast to the rest of the market, which is expected to grow by 8.2% over the next year, materially higher than the company's recent medium-term annualised growth rates.
With this information, we find it concerning that Menang Corporation (M) Berhad is trading at a P/E higher than the market. Apparently many investors in the company are way more bullish than recent times would indicate and aren't willing to let go of their stock at any price. Only the boldest would assume these prices are sustainable as a continuation of recent earnings trends is likely to weigh heavily on the share price eventually.
The Key Takeaway
Typically, we'd caution against reading too much into price-to-earnings ratios when settling on investment decisions, though it can reveal plenty about what other market participants think about the company.
Our examination of Menang Corporation (M) Berhad revealed its three-year earnings trends aren't impacting its high P/E anywhere near as much as we would have predicted, given they look worse than current market expectations. When we see weak earnings with slower than market growth, we suspect the share price is at risk of declining, sending the high P/E lower. If recent medium-term earnings trends continue, it will place shareholders' investments at significant risk and potential investors in danger of paying an excessive premium.
You should always think about risks. Case in point, we've spotted 4 warning signs for Menang Corporation (M) Berhad you should be aware of, and 1 of them makes us a bit uncomfortable.
If you're unsure about the strength of Menang Corporation (M) Berhad's business, why not explore our interactive list of stocks with solid business fundamentals for some other companies you may have missed.
Have feedback on this article? Concerned about the content? Get in touch with us directly. Alternatively, email editorial-team (at) simplywallst.com.
This article by Simply Wall St is general in nature. We provide commentary based on historical data and analyst forecasts only using an unbiased methodology and our articles are not intended to be financial advice. It does not constitute a recommendation to buy or sell any stock, and does not take account of your objectives, or your financial situation. We aim to bring you long-term focused analysis driven by fundamental data. Note that our analysis may not factor in the latest price-sensitive company announcements or qualitative material. Simply Wall St has no position in any stocks mentioned.
Join A Paid User Research Session
You’ll receive a US$30 Amazon Gift card for 1 hour of your time while helping us build better investing tools for the individual investors like yourself. Sign up here
