
 Yahoo Finance
 Shareholders in Renold (LON:RNO) are in the red if they invested five years ago
Statistically speaking, long term investing is a profitable endeavour. But along the way some stocks are going to perform badly. For example the Renold plc (LON:RNO) share price dropped 53% over five years. That's not a lot of fun for true believers.
Now let's have a look at the company's fundamentals, and see if the long term shareholder return has matched the performance of the underlying business.
View our latest analysis for Renold
There is no denying that markets are sometimes efficient, but prices do not always reflect underlying business performance. One imperfect but simple way to consider how the market perception of a company has shifted is to compare the change in the earnings per share (EPS) with the share price movement.
During the unfortunate half decade during which the share price slipped, Renold actually saw its earnings per share (EPS) improve by 18% per year. Given the share price reaction, one might suspect that EPS is not a good guide to the business performance during the period (perhaps due to a one-off loss or gain). Alternatively, growth expectations may have been unreasonable in the past.
Due to the lack of correlation between the EPS growth and the falling share price, it's worth taking a look at other metrics to try to understand the share price movement.
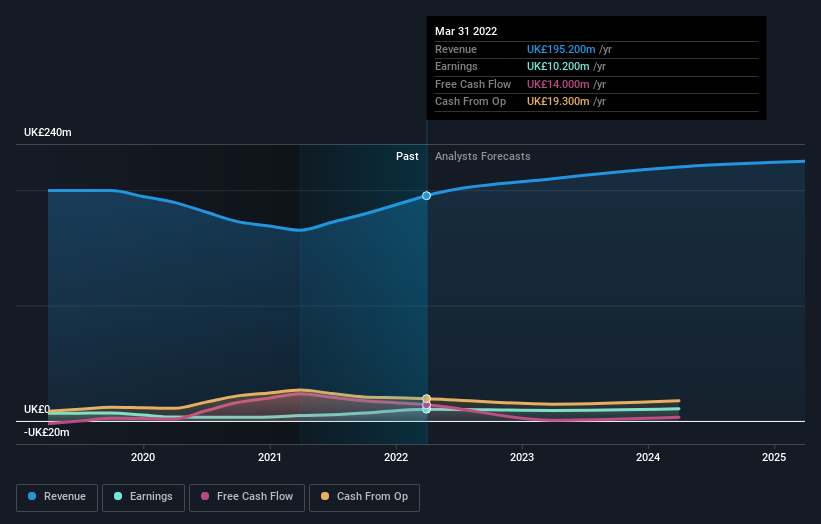
The revenue decline of 1.5% isn't too bad. But it's quite possible the market had expected better; a closer look at the revenue trends might explain the pessimism.
You can see below how earnings and revenue have changed over time (discover the exact values by clicking on the image).
We know that Renold has improved its bottom line lately, but what does the future have in store? This free report showing analyst forecasts should help you form a view on Renold
A Different Perspective
It's good to see that Renold has rewarded shareholders with a total shareholder return of 23% in the last twelve months. There's no doubt those recent returns are much better than the TSR loss of 9% per year over five years. This makes us a little wary, but the business might have turned around its fortunes. It's always interesting to track share price performance over the longer term. But to understand Renold better, we need to consider many other factors. Consider risks, for instance. Every company has them, and we've spotted 2 warning signs for Renold you should know about.
But note: Renold may not be the best stock to buy. So take a peek at this free list of interesting companies with past earnings growth (and further growth forecast).
Please note, the market returns quoted in this article reflect the market weighted average returns of stocks that currently trade on GB exchanges.
Have feedback on this article? Concerned about the content? Get in touch with us directly. Alternatively, email editorial-team (at) simplywallst.com.
This article by Simply Wall St is general in nature. We provide commentary based on historical data and analyst forecasts only using an unbiased methodology and our articles are not intended to be financial advice. It does not constitute a recommendation to buy or sell any stock, and does not take account of your objectives, or your financial situation. We aim to bring you long-term focused analysis driven by fundamental data. Note that our analysis may not factor in the latest price-sensitive company announcements or qualitative material. Simply Wall St has no position in any stocks mentioned.
Join A Paid User Research Session
You’ll receive a US$30 Amazon Gift card for 1 hour of your time while helping us build better investing tools for the individual investors like yourself. Sign up here
