
 Yahoo Finance
 Shareholders in Simply Better Brands (CVE:SBBC) are in the red if they invested a year ago
Taking the occasional loss comes part and parcel with investing on the stock market. And unfortunately for Simply Better Brands Corp. (CVE:SBBC) shareholders, the stock is a lot lower today than it was a year ago. In that relatively short period, the share price has plunged 58%. We wouldn't rush to judgement on Simply Better Brands because we don't have a long term history to look at. The falls have accelerated recently, with the share price down 44% in the last three months. We note that the company has reported results fairly recently; and the market is hardly delighted. You can check out the latest numbers in our company report.
It's worthwhile assessing if the company's economics have been moving in lockstep with these underwhelming shareholder returns, or if there is some disparity between the two. So let's do just that.
Check out our latest analysis for Simply Better Brands
Given that Simply Better Brands didn't make a profit in the last twelve months, we'll focus on revenue growth to form a quick view of its business development. Generally speaking, companies without profits are expected to grow revenue every year, and at a good clip. As you can imagine, fast revenue growth, when maintained, often leads to fast profit growth.
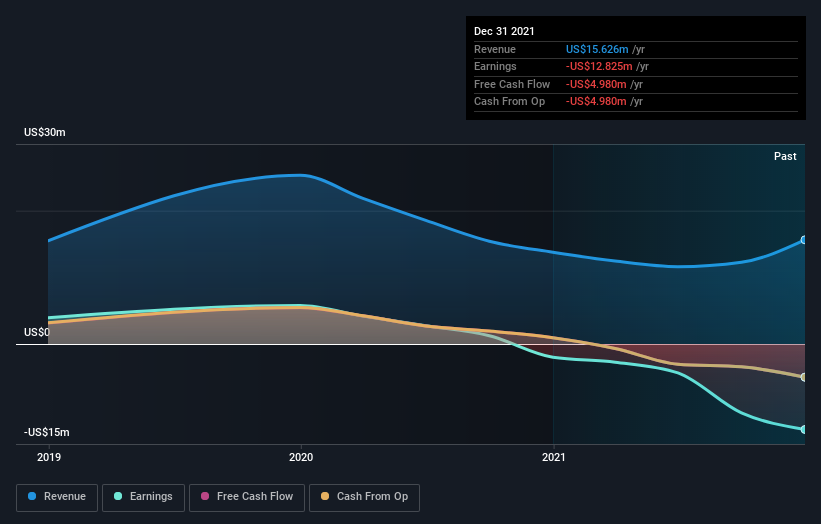
Simply Better Brands grew its revenue by 13% over the last year. That's not a very high growth rate considering it doesn't make profits. It's likely this muted growth has contributed to the share price decline of 58% in the last year. We'd want to see evidence that future revenue growth will be stronger before getting too interested. Of course, the market can be too impatient at times. Why not take a closer look at this one so you're ready to pounce if growth does accelerate.
The graphic below depicts how earnings and revenue have changed over time (unveil the exact values by clicking on the image).
You can see how its balance sheet has strengthened (or weakened) over time in this free interactive graphic.
A Different Perspective
Given that the market gained 7.7% in the last year, Simply Better Brands shareholders might be miffed that they lost 58%. However, keep in mind that even the best stocks will sometimes underperform the market over a twelve month period. With the stock down 44% over the last three months, the market doesn't seem to believe that the company has solved all its problems. Given the relatively short history of this stock, we'd remain pretty wary until we see some strong business performance. It's always interesting to track share price performance over the longer term. But to understand Simply Better Brands better, we need to consider many other factors. Even so, be aware that Simply Better Brands is showing 4 warning signs in our investment analysis , and 2 of those don't sit too well with us...
If you would prefer to check out another company -- one with potentially superior financials -- then do not miss this free list of companies that have proven they can grow earnings.
Please note, the market returns quoted in this article reflect the market weighted average returns of stocks that currently trade on CA exchanges.
Have feedback on this article? Concerned about the content? Get in touch with us directly. Alternatively, email editorial-team (at) simplywallst.com.
This article by Simply Wall St is general in nature. We provide commentary based on historical data and analyst forecasts only using an unbiased methodology and our articles are not intended to be financial advice. It does not constitute a recommendation to buy or sell any stock, and does not take account of your objectives, or your financial situation. We aim to bring you long-term focused analysis driven by fundamental data. Note that our analysis may not factor in the latest price-sensitive company announcements or qualitative material. Simply Wall St has no position in any stocks mentioned.
