
 Yahoo Finance
 Shareholders in SKY Network Television (NZSE:SKT) are in the red if they invested five years ago
SKY Network Television Limited (NZSE:SKT) shareholders should be happy to see the share price up 17% in the last quarter. But that doesn't change the fact that the returns over the last half decade have been disappointing. Indeed, the share price is down 93% in the period. So we're hesitant to put much weight behind the short term increase. We'd err towards caution given the long term under-performance. We really hope anyone holding through that price crash has a diversified portfolio. Even when you lose money, you don't have to lose the lesson.
So let's have a look and see if the longer term performance of the company has been in line with the underlying business' progress.
View our latest analysis for SKY Network Television
In his essay The Superinvestors of Graham-and-Doddsville Warren Buffett described how share prices do not always rationally reflect the value of a business. One way to examine how market sentiment has changed over time is to look at the interaction between a company's share price and its earnings per share (EPS).
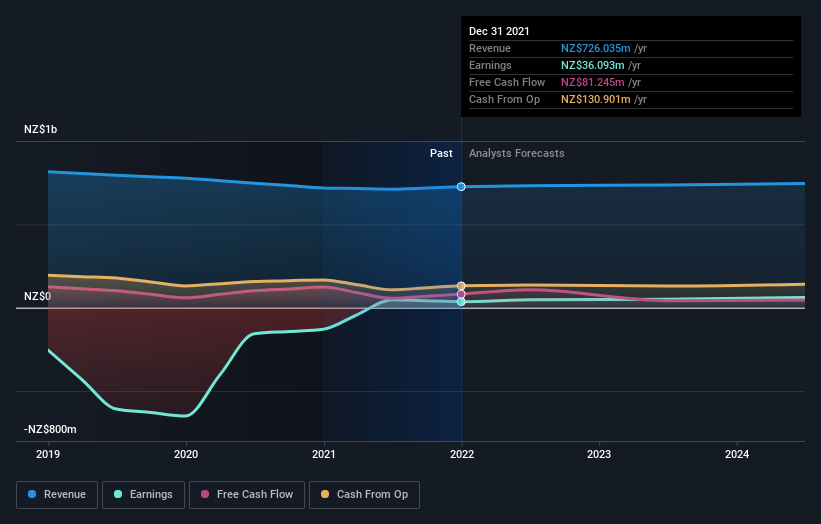
During five years of share price growth, SKY Network Television moved from a loss to profitability. That would generally be considered a positive, so we are surprised to see the share price is down. Other metrics may better explain the share price move.
Arguably, the revenue drop of 5.5% a year for half a decade suggests that the company can't grow in the long term. This has probably encouraged some shareholders to sell down the stock.
You can see how earnings and revenue have changed over time in the image below (click on the chart to see the exact values).
We consider it positive that insiders have made significant purchases in the last year. Even so, future earnings will be far more important to whether current shareholders make money. So it makes a lot of sense to check out what analysts think SKY Network Television will earn in the future (free profit forecasts).
What about the Total Shareholder Return (TSR)?
We'd be remiss not to mention the difference between SKY Network Television's total shareholder return (TSR) and its share price return. The TSR attempts to capture the value of dividends (as if they were reinvested) as well as any spin-offs or discounted capital raisings offered to shareholders. SKY Network Television's TSR of was a loss of 70% for the 5 years. That wasn't as bad as its share price return, because it has paid dividends.
A Different Perspective
It's nice to see that SKY Network Television shareholders have received a total shareholder return of 60% over the last year. Notably the five-year annualised TSR loss of 11% per year compares very unfavourably with the recent share price performance. This makes us a little wary, but the business might have turned around its fortunes. It's always interesting to track share price performance over the longer term. But to understand SKY Network Television better, we need to consider many other factors. To that end, you should be aware of the 1 warning sign we've spotted with SKY Network Television .
If you like to buy stocks alongside management, then you might just love this free list of companies. (Hint: insiders have been buying them).
Please note, the market returns quoted in this article reflect the market weighted average returns of stocks that currently trade on NZ exchanges.
Have feedback on this article? Concerned about the content? Get in touch with us directly. Alternatively, email editorial-team (at) simplywallst.com.
This article by Simply Wall St is general in nature. We provide commentary based on historical data and analyst forecasts only using an unbiased methodology and our articles are not intended to be financial advice. It does not constitute a recommendation to buy or sell any stock, and does not take account of your objectives, or your financial situation. We aim to bring you long-term focused analysis driven by fundamental data. Note that our analysis may not factor in the latest price-sensitive company announcements or qualitative material. Simply Wall St has no position in any stocks mentioned.
