
 Yahoo Finance
 Shareholders in Yelp (NYSE:YELP) have lost 32%, as stock drops 8.1% this past week
The simplest way to benefit from a rising market is to buy an index fund. Active investors aim to buy stocks that vastly outperform the market - but in the process, they risk under-performance. Unfortunately the Yelp Inc. (NYSE:YELP) share price slid 32% over twelve months. That's well below the market decline of 20%. However, the longer term returns haven't been so bad, with the stock down 20% in the last three years. Shareholders have had an even rougher run lately, with the share price down 21% in the last 90 days. However, one could argue that the price has been influenced by the general market, which is down 17% in the same timeframe.
With the stock having lost 8.1% in the past week, it's worth taking a look at business performance and seeing if there's any red flags.
See our latest analysis for Yelp
To paraphrase Benjamin Graham: Over the short term the market is a voting machine, but over the long term it's a weighing machine. One way to examine how market sentiment has changed over time is to look at the interaction between a company's share price and its earnings per share (EPS).
During the last year Yelp grew its earnings per share, moving from a loss to a profit.
When a company has just transitioned to profitability, earnings per share growth is not always the best way to look at the share price action. So it makes sense to check out some other factors.
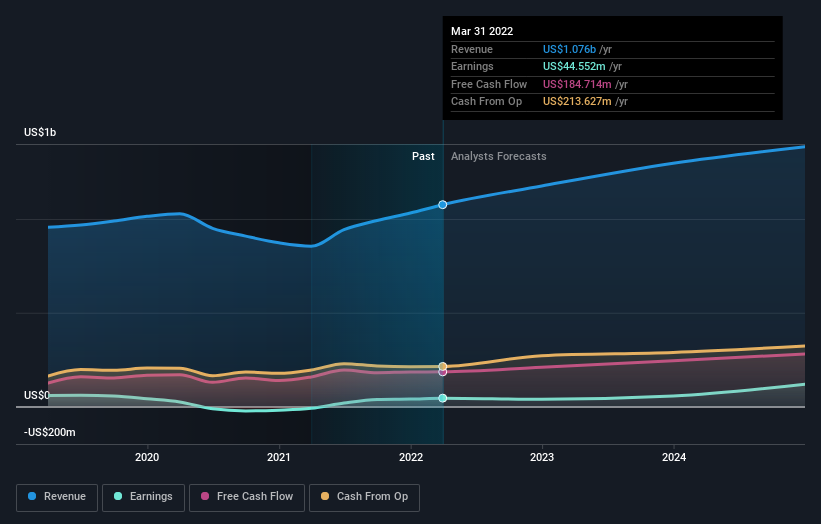
Yelp managed to grow revenue over the last year, which is usually a real positive. Since we can't easily explain the share price movement based on these metrics, it might be worth considering how market sentiment has changed towards the stock.
The graphic below depicts how earnings and revenue have changed over time (unveil the exact values by clicking on the image).
Yelp is well known by investors, and plenty of clever analysts have tried to predict the future profit levels. Given we have quite a good number of analyst forecasts, it might be well worth checking out this free chart depicting consensus estimates.
A Different Perspective
We regret to report that Yelp shareholders are down 32% for the year. Unfortunately, that's worse than the broader market decline of 20%. Having said that, it's inevitable that some stocks will be oversold in a falling market. The key is to keep your eyes on the fundamental developments. Unfortunately, last year's performance may indicate unresolved challenges, given that it was worse than the annualised loss of 1.1% over the last half decade. Generally speaking long term share price weakness can be a bad sign, though contrarian investors might want to research the stock in hope of a turnaround. I find it very interesting to look at share price over the long term as a proxy for business performance. But to truly gain insight, we need to consider other information, too. Take risks, for example - Yelp has 2 warning signs we think you should be aware of.
If you would prefer to check out another company -- one with potentially superior financials -- then do not miss this free list of companies that have proven they can grow earnings.
Please note, the market returns quoted in this article reflect the market weighted average returns of stocks that currently trade on US exchanges.
Have feedback on this article? Concerned about the content? Get in touch with us directly. Alternatively, email editorial-team (at) simplywallst.com.
This article by Simply Wall St is general in nature. We provide commentary based on historical data and analyst forecasts only using an unbiased methodology and our articles are not intended to be financial advice. It does not constitute a recommendation to buy or sell any stock, and does not take account of your objectives, or your financial situation. We aim to bring you long-term focused analysis driven by fundamental data. Note that our analysis may not factor in the latest price-sensitive company announcements or qualitative material. Simply Wall St has no position in any stocks mentioned.
