
 Yahoo Finance
 Simulations Plus (NASDAQ:SLP) May Have Issues Allocating Its Capital
What are the early trends we should look for to identify a stock that could multiply in value over the long term? Firstly, we'll want to see a proven return on capital employed (ROCE) that is increasing, and secondly, an expanding base of capital employed. If you see this, it typically means it's a company with a great business model and plenty of profitable reinvestment opportunities. Having said that, from a first glance at Simulations Plus (NASDAQ:SLP) we aren't jumping out of our chairs at how returns are trending, but let's have a deeper look.
Understanding Return On Capital Employed (ROCE)
For those who don't know, ROCE is a measure of a company's yearly pre-tax profit (its return), relative to the capital employed in the business. To calculate this metric for Simulations Plus, this is the formula:
Return on Capital Employed = Earnings Before Interest and Tax (EBIT) ÷ (Total Assets - Current Liabilities)
0.083 = US$15m ÷ (US$188m - US$7.7m) (Based on the trailing twelve months to August 2022).
Therefore, Simulations Plus has an ROCE of 8.3%. On its own that's a low return on capital but it's in line with the industry's average returns of 7.5%.
View our latest analysis for Simulations Plus
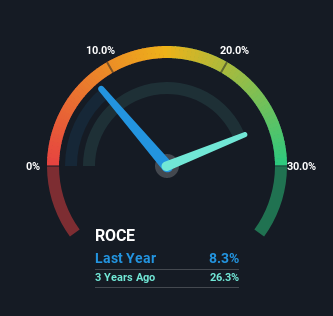
Above you can see how the current ROCE for Simulations Plus compares to its prior returns on capital, but there's only so much you can tell from the past. If you're interested, you can view the analysts predictions in our free report on analyst forecasts for the company.
The Trend Of ROCE
On the surface, the trend of ROCE at Simulations Plus doesn't inspire confidence. To be more specific, ROCE has fallen from 24% over the last five years. Although, given both revenue and the amount of assets employed in the business have increased, it could suggest the company is investing in growth, and the extra capital has led to a short-term reduction in ROCE. And if the increased capital generates additional returns, the business, and thus shareholders, will benefit in the long run.
The Bottom Line On Simulations Plus' ROCE
Even though returns on capital have fallen in the short term, we find it promising that revenue and capital employed have both increased for Simulations Plus. And the stock has done incredibly well with a 137% return over the last five years, so long term investors are no doubt ecstatic with that result. So should these growth trends continue, we'd be optimistic on the stock going forward.
If you're still interested in Simulations Plus it's worth checking out our FREE intrinsic value approximation to see if it's trading at an attractive price in other respects.
For those who like to invest in solid companies, check out this free list of companies with solid balance sheets and high returns on equity.
Have feedback on this article? Concerned about the content? Get in touch with us directly. Alternatively, email editorial-team (at) simplywallst.com.
This article by Simply Wall St is general in nature. We provide commentary based on historical data and analyst forecasts only using an unbiased methodology and our articles are not intended to be financial advice. It does not constitute a recommendation to buy or sell any stock, and does not take account of your objectives, or your financial situation. We aim to bring you long-term focused analysis driven by fundamental data. Note that our analysis may not factor in the latest price-sensitive company announcements or qualitative material. Simply Wall St has no position in any stocks mentioned.
Join A Paid User Research Session
You’ll receive a US$30 Amazon Gift card for 1 hour of your time while helping us build better investing tools for the individual investors like yourself. Sign up here
