
 Yahoo Finance
 Skechers U.S.A (NYSE:SKX) shareholders have earned a 3.3% CAGR over the last five years
When you buy and hold a stock for the long term, you definitely want it to provide a positive return. Better yet, you'd like to see the share price move up more than the market average. Unfortunately for shareholders, while the Skechers U.S.A., Inc. (NYSE:SKX) share price is up 17% in the last five years, that's less than the market return. Zooming in, the stock is actually down 5.1% in the last year.
Now it's worth having a look at the company's fundamentals too, because that will help us determine if the long term shareholder return has matched the performance of the underlying business.
View our latest analysis for Skechers U.S.A
While markets are a powerful pricing mechanism, share prices reflect investor sentiment, not just underlying business performance. By comparing earnings per share (EPS) and share price changes over time, we can get a feel for how investor attitudes to a company have morphed over time.
During five years of share price growth, Skechers U.S.A achieved compound earnings per share (EPS) growth of 23% per year. This EPS growth is higher than the 3% average annual increase in the share price. So it seems the market isn't so enthusiastic about the stock these days. This cautious sentiment is reflected in its (fairly low) P/E ratio of 9.61.
The graphic below depicts how EPS has changed over time (unveil the exact values by clicking on the image).
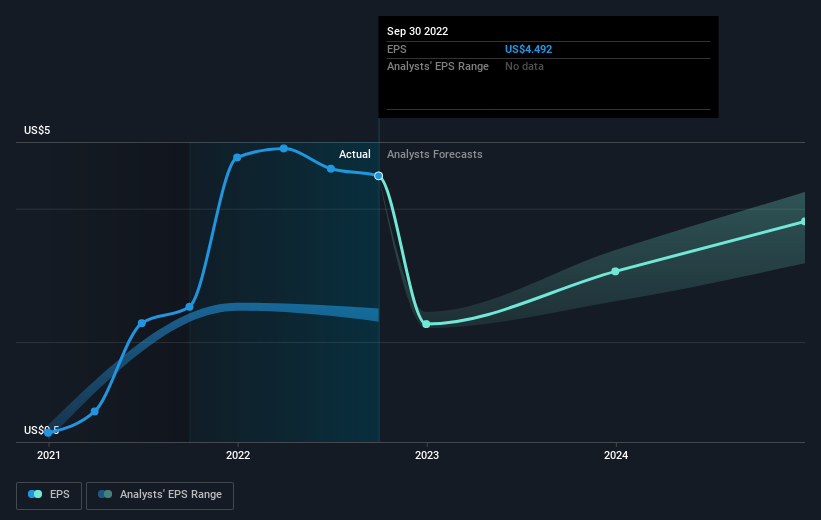
We like that insiders have been buying shares in the last twelve months. Having said that, most people consider earnings and revenue growth trends to be a more meaningful guide to the business. Before buying or selling a stock, we always recommend a close examination of historic growth trends, available here..
A Different Perspective
Although it hurts that Skechers U.S.A returned a loss of 5.1% in the last twelve months, the broader market was actually worse, returning a loss of 18%. Of course, the long term returns are far more important and the good news is that over five years, the stock has returned 3% for each year. In the best case scenario the last year is just a temporary blip on the journey to a brighter future. While it is well worth considering the different impacts that market conditions can have on the share price, there are other factors that are even more important. To that end, you should learn about the 2 warning signs we've spotted with Skechers U.S.A (including 1 which is significant) .
Skechers U.S.A is not the only stock that insiders are buying. For those who like to find winning investments this free list of growing companies with recent insider purchasing, could be just the ticket.
Please note, the market returns quoted in this article reflect the market weighted average returns of stocks that currently trade on US exchanges.
Have feedback on this article? Concerned about the content? Get in touch with us directly. Alternatively, email editorial-team (at) simplywallst.com.
This article by Simply Wall St is general in nature. We provide commentary based on historical data and analyst forecasts only using an unbiased methodology and our articles are not intended to be financial advice. It does not constitute a recommendation to buy or sell any stock, and does not take account of your objectives, or your financial situation. We aim to bring you long-term focused analysis driven by fundamental data. Note that our analysis may not factor in the latest price-sensitive company announcements or qualitative material. Simply Wall St has no position in any stocks mentioned.
Join A Paid User Research Session
You’ll receive a US$30 Amazon Gift card for 1 hour of your time while helping us build better investing tools for the individual investors like yourself. Sign up here
