
 Yahoo Finance
 Slowing Rates Of Return At Ricegrowers (ASX:SGLLV) Leave Little Room For Excitement
There are a few key trends to look for if we want to identify the next multi-bagger. Firstly, we'll want to see a proven return on capital employed (ROCE) that is increasing, and secondly, an expanding base of capital employed. If you see this, it typically means it's a company with a great business model and plenty of profitable reinvestment opportunities. So, when we ran our eye over Ricegrowers' (ASX:SGLLV) trend of ROCE, we liked what we saw.
What Is Return On Capital Employed (ROCE)?
Just to clarify if you're unsure, ROCE is a metric for evaluating how much pre-tax income (in percentage terms) a company earns on the capital invested in its business. Analysts use this formula to calculate it for Ricegrowers:
Return on Capital Employed = Earnings Before Interest and Tax (EBIT) ÷ (Total Assets - Current Liabilities)
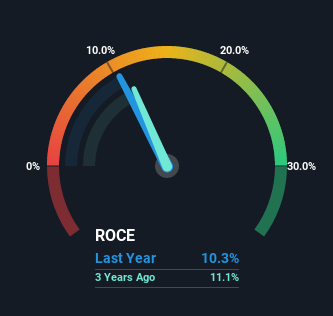
0.10 = AU$65m ÷ (AU$1.2b - AU$573m) (Based on the trailing twelve months to April 2022).
So, Ricegrowers has an ROCE of 10%. On its own, that's a standard return, however it's much better than the 7.1% generated by the Food industry.
Check out our latest analysis for Ricegrowers
In the above chart we have measured Ricegrowers' prior ROCE against its prior performance, but the future is arguably more important. If you'd like, you can check out the forecasts from the analysts covering Ricegrowers here for free.
What The Trend Of ROCE Can Tell Us
While the returns on capital are good, they haven't moved much. The company has consistently earned 10% for the last five years, and the capital employed within the business has risen 23% in that time. Since 10% is a moderate ROCE though, it's good to see a business can continue to reinvest at these decent rates of return. Over long periods of time, returns like these might not be too exciting, but with consistency they can pay off in terms of share price returns.
On another note, while the change in ROCE trend might not scream for attention, it's interesting that the current liabilities have actually gone up over the last five years. This is intriguing because if current liabilities hadn't increased to 48% of total assets, this reported ROCE would probably be less than10% because total capital employed would be higher.The 10% ROCE could be even lower if current liabilities weren't 48% of total assets, because the the formula would show a larger base of total capital employed. So with current liabilities at such high levels, this effectively means the likes of suppliers or short-term creditors are funding a meaningful part of the business, which in some instances can bring some risks.
Our Take On Ricegrowers' ROCE
In the end, Ricegrowers has proven its ability to adequately reinvest capital at good rates of return. And long term investors would be thrilled with the 119% return they've received over the last five years. So while investors seem to be recognizing these promising trends, we still believe the stock deserves further research.
One final note, you should learn about the 2 warning signs we've spotted with Ricegrowers (including 1 which is concerning) .
For those who like to invest in solid companies, check out this free list of companies with solid balance sheets and high returns on equity.
Have feedback on this article? Concerned about the content? Get in touch with us directly. Alternatively, email editorial-team (at) simplywallst.com.
This article by Simply Wall St is general in nature. We provide commentary based on historical data and analyst forecasts only using an unbiased methodology and our articles are not intended to be financial advice. It does not constitute a recommendation to buy or sell any stock, and does not take account of your objectives, or your financial situation. We aim to bring you long-term focused analysis driven by fundamental data. Note that our analysis may not factor in the latest price-sensitive company announcements or qualitative material. Simply Wall St has no position in any stocks mentioned.
Join A Paid User Research Session
You’ll receive a US$30 Amazon Gift card for 1 hour of your time while helping us build better investing tools for the individual investors like yourself. Sign up here
