
 Yahoo Finance
 Is SmartRent, Inc.'s (NYSE:SMRT) Shareholder Ownership Skewed Towards Insiders?
If you want to know who really controls SmartRent, Inc. (NYSE:SMRT), then you'll have to look at the makeup of its share registry. Institutions will often hold stock in bigger companies, and we expect to see insiders owning a noticeable percentage of the smaller ones. Warren Buffett said that he likes "a business with enduring competitive advantages that is run by able and owner-oriented people." So it's nice to see some insider ownership, because it may suggest that management is owner-oriented.
SmartRent isn't enormous, but it's not particularly small either. It has a market capitalization of US$949m, which means it would generally expect to see some institutions on the share registry. In the chart below, we can see that institutions own shares in the company. Let's take a closer look to see what the different types of shareholders can tell us about SmartRent.
Check out our latest analysis for SmartRent
What Does The Institutional Ownership Tell Us About SmartRent?
Institutional investors commonly compare their own returns to the returns of a commonly followed index. So they generally do consider buying larger companies that are included in the relevant benchmark index.
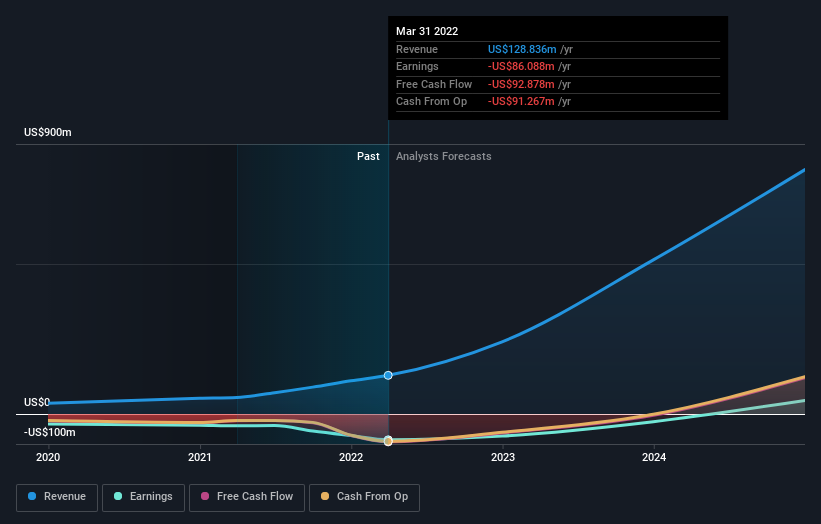
We can see that SmartRent does have institutional investors; and they hold a good portion of the company's stock. This implies the analysts working for those institutions have looked at the stock and they like it. But just like anyone else, they could be wrong. If multiple institutions change their view on a stock at the same time, you could see the share price drop fast. It's therefore worth looking at SmartRent's earnings history below. Of course, the future is what really matters.
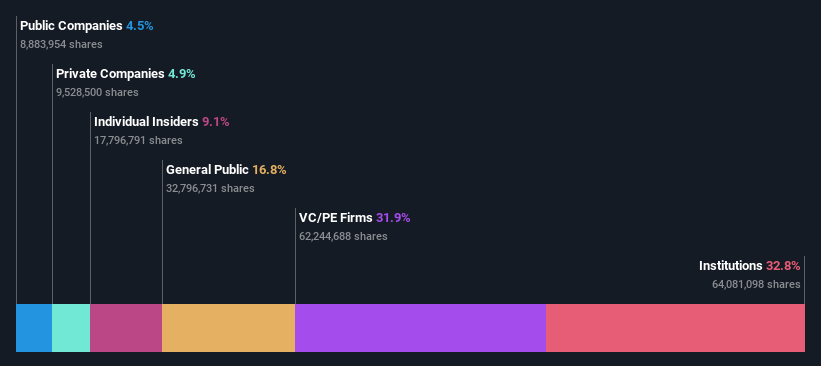
We note that hedge funds don't have a meaningful investment in SmartRent. The company's largest shareholder is RETV Management LLC, with ownership of 15%. Meanwhile, the second and third largest shareholders, hold 11% and 8.1%, of the shares outstanding, respectively. In addition, we found that Lucas Haldeman, the CEO has 5.6% of the shares allocated to their name.
On further inspection, we found that more than half the company's shares are owned by the top 6 shareholders, suggesting that the interests of the larger shareholders are balanced out to an extent by the smaller ones.
While it makes sense to study institutional ownership data for a company, it also makes sense to study analyst sentiments to know which way the wind is blowing. There are a reasonable number of analysts covering the stock, so it might be useful to find out their aggregate view on the future.
Insider Ownership Of SmartRent
While the precise definition of an insider can be subjective, almost everyone considers board members to be insiders. Company management run the business, but the CEO will answer to the board, even if he or she is a member of it.
Insider ownership is positive when it signals leadership are thinking like the true owners of the company. However, high insider ownership can also give immense power to a small group within the company. This can be negative in some circumstances.
Our most recent data indicates that insiders own some shares in SmartRent, Inc.. In their own names, insiders own US$86m worth of stock in the US$949m company. Some would say this shows alignment of interests between shareholders and the board. But it might be worth checking if those insiders have been selling.
General Public Ownership
With a 17% ownership, the general public, mostly comprising of individual investors, have some degree of sway over SmartRent. While this group can't necessarily call the shots, it can certainly have a real influence on how the company is run.
Private Equity Ownership
With an ownership of 32%, private equity firms are in a position to play a role in shaping corporate strategy with a focus on value creation. Some investors might be encouraged by this, since private equity are sometimes able to encourage strategies that help the market see the value in the company. Alternatively, those holders might be exiting the investment after taking it public.
Private Company Ownership
It seems that Private Companies own 4.9%, of the SmartRent stock. Private companies may be related parties. Sometimes insiders have an interest in a public company through a holding in a private company, rather than in their own capacity as an individual. While it's hard to draw any broad stroke conclusions, it is worth noting as an area for further research.
Public Company Ownership
It appears to us that public companies own 4.5% of SmartRent. It's hard to say for sure but this suggests they have entwined business interests. This might be a strategic stake, so it's worth watching this space for changes in ownership.
Next Steps:
It's always worth thinking about the different groups who own shares in a company. But to understand SmartRent better, we need to consider many other factors. Consider risks, for instance. Every company has them, and we've spotted 1 warning sign for SmartRent you should know about.
If you are like me, you may want to think about whether this company will grow or shrink. Luckily, you can check this free report showing analyst forecasts for its future.
NB: Figures in this article are calculated using data from the last twelve months, which refer to the 12-month period ending on the last date of the month the financial statement is dated. This may not be consistent with full year annual report figures.
Have feedback on this article? Concerned about the content? Get in touch with us directly. Alternatively, email editorial-team (at) simplywallst.com.
This article by Simply Wall St is general in nature. We provide commentary based on historical data and analyst forecasts only using an unbiased methodology and our articles are not intended to be financial advice. It does not constitute a recommendation to buy or sell any stock, and does not take account of your objectives, or your financial situation. We aim to bring you long-term focused analysis driven by fundamental data. Note that our analysis may not factor in the latest price-sensitive company announcements or qualitative material. Simply Wall St has no position in any stocks mentioned.
Join A Paid User Research Session
You’ll receive a US$30 Amazon Gift card for 1 hour of your time while helping us build better investing tools for the individual investors like yourself. Sign up here
