
 Yahoo Finance
 Should Smiths Group (LON:SMIN) Be Disappointed With Their 24% Profit?

Generally speaking the aim of active stock picking is to find companies that provide returns that are superior to the market average. And in our experience, buying the right stocks can give your wealth a significant boost. For example, long term Smiths Group plc (LON:SMIN) shareholders have enjoyed a 24% share price rise over the last half decade, well in excess of the market return of around 4.9% (not including dividends). However, more recent returns haven't been as impressive as that, with the stock returning just 5.1% in the last year , including dividends .
Check out our latest analysis for Smiths Group
To paraphrase Benjamin Graham: Over the short term the market is a voting machine, but over the long term it's a weighing machine. One way to examine how market sentiment has changed over time is to look at the interaction between a company's share price and its earnings per share (EPS).
During five years of share price growth, Smiths Group actually saw its EPS drop 9.8% per year.
Since the EPS are down strongly, it seems highly unlikely market participants are looking at EPS to value the company. Given that EPS is down, but the share price is up, it seems clear the market is focussed on other aspects of the business, at the moment.
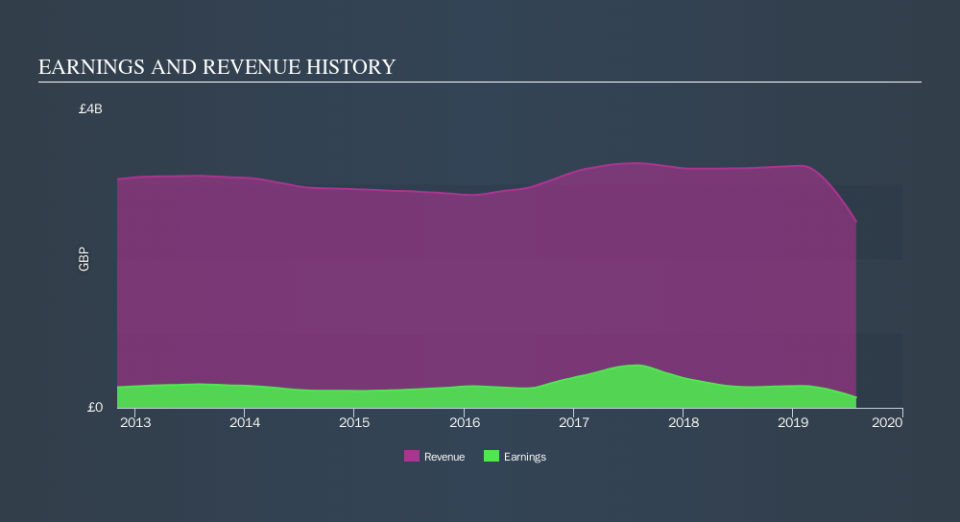
We are not particularly impressed by the annual compound revenue growth of 1.4% over five years. So it seems one might have to take closer look at earnings and revenue trends to see how they might influence the share price.
You can see how earnings and revenue have changed over time in the image below (click on the chart to see the exact values).
Smiths Group is a well known stock, with plenty of analyst coverage, suggesting some visibility into future growth. Given we have quite a good number of analyst forecasts, it might be well worth checking out this free chart depicting consensus estimates.
What About Dividends?
As well as measuring the share price return, investors should also consider the total shareholder return (TSR). Whereas the share price return only reflects the change in the share price, the TSR includes the value of dividends (assuming they were reinvested) and the benefit of any discounted capital raising or spin-off. It's fair to say that the TSR gives a more complete picture for stocks that pay a dividend. We note that for Smiths Group the TSR over the last 5 years was 47%, which is better than the share price return mentioned above. The dividends paid by the company have thusly boosted the total shareholder return.
A Different Perspective
It's nice to see that Smiths Group shareholders have received a total shareholder return of 5.1% over the last year. That's including the dividend. However, that falls short of the 8.0% TSR per annum it has made for shareholders, each year, over five years. Potential buyers might understandably feel they've missed the opportunity, but it's always possible business is still firing on all cylinders. If you would like to research Smiths Group in more detail then you might want to take a look at whether insiders have been buying or selling shares in the company.
If you would prefer to check out another company -- one with potentially superior financials -- then do not miss this free list of companies that have proven they can grow earnings.
Please note, the market returns quoted in this article reflect the market weighted average returns of stocks that currently trade on GB exchanges.
We aim to bring you long-term focused research analysis driven by fundamental data. Note that our analysis may not factor in the latest price-sensitive company announcements or qualitative material.
If you spot an error that warrants correction, please contact the editor at editorial-team@simplywallst.com. This article by Simply Wall St is general in nature. It does not constitute a recommendation to buy or sell any stock, and does not take account of your objectives, or your financial situation. Simply Wall St has no position in the stocks mentioned. Thank you for reading.
