
 Yahoo Finance
 Something To Consider Before Buying Spark New Zealand Limited (NZSE:SPK) For The 6.0% Dividend

Want to participate in a short research study? Help shape the future of investing tools and you could win a $250 gift card!
Today we'll take a closer look at Spark New Zealand Limited (NZSE:SPK) from a dividend investor's perspective. Owning a strong business and reinvesting the dividends is widely seen as an attractive way of growing your wealth. If you are hoping to live on your dividends, it's important to be more stringent with your investments than the average punter. Regular readers know we like to apply the same approach to each dividend stock, and we hope you'll find our analysis useful.
With Spark New Zealand yielding 6.0% and having paid a dividend for over 10 years, many investors likely find the company quite interesting. We'd guess that plenty of investors have purchased it for the income. Some simple research can reduce the risk of buying Spark New Zealand for its dividend - read on to learn more.
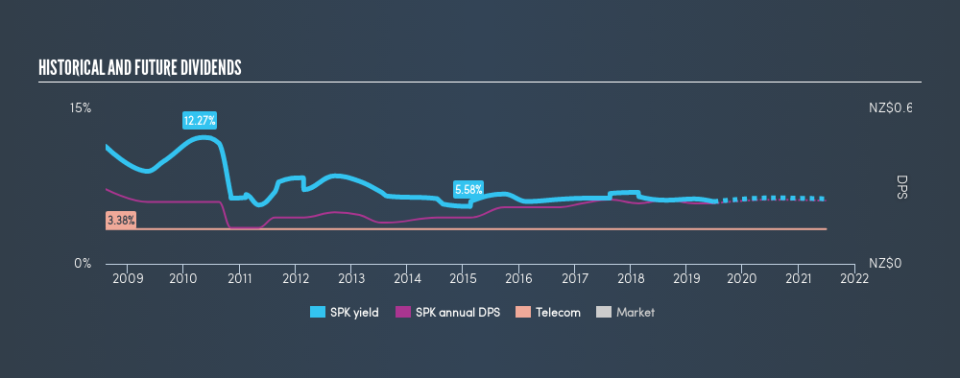
Click the interactive chart for our full dividend analysis
Payout ratios
Dividends are usually paid out of company earnings. If a company is paying more than it earns, then the dividend might become unsustainable - hardly an ideal situation. As a result, we should always investigate whether a company can afford its dividend, measured as a percentage of a company's net income after tax. Spark New Zealand paid out 107% of its profit as dividends, over the trailing twelve month period. Unless there are extenuating circumstances, from the perspective of an investor who hopes to own the company for many years, a payout ratio of above 100% is definitely a concern.
In addition to comparing dividends against profits, we should inspect whether the company generated enough cash to pay its dividend. Spark New Zealand paid out 134% of its free cash last year. Cash flows can be lumpy, but this dividend was not well covered by cash flow. Paying out such a high percentage of cash flow suggests that the dividend was funded from either cash at bank or by borrowing, neither of which is desirable over the long term. Cash is slightly more important than profit from a dividend perspective, but given Spark New Zealand's payouts were not well covered by either earnings or cash flow, we would definitely be concerned about the sustainability of this dividend.
Is Spark New Zealand's Balance Sheet Risky?
As Spark New Zealand's dividend was not well covered by earnings, we need to check its balance sheet for signs of financial distress. A rough way to check this is with these two simple ratios: a) net debt divided by EBITDA (earnings before interest, tax, depreciation and amortisation), and b) net interest cover. Net debt to EBITDA measures a company's total debt load relative to its earnings (lower = less debt), while net interest cover measures the company's ability to pay the interest on its debt (higher = greater ability to pay interest costs). Spark New Zealand has net debt of less than two times its earnings before interest, tax, depreciation, and amortisation (EBITDA), which we think is not too troublesome.
We calculated its interest cover by measuring its earnings before interest and tax (EBIT), and dividing this by the company's net interest expense. Net interest cover of 10.84 times its interest expense appears reasonable for Spark New Zealand, although we're conscious that even high interest cover doesn't make a company bulletproof.
We update our data on Spark New Zealand every 24 hours, so you can always get our latest analysis of its financial health, here.
Dividend Volatility
Before buying a stock for its income, we want to see if the dividends have been stable in the past, and if the company has a track record of maintaining its dividend. Spark New Zealand has been paying dividends for a long time, but for the purpose of this analysis, we only examine the past 10 years of payments. Its dividend payments have fallen by 20% or more on at least one occasion over the past ten years. During the past ten-year period, the first annual payment was NZ$0.29 in 2009, compared to NZ$0.23 last year. The dividend has shrunk at around 2.1% a year during that period. Spark New Zealand's dividend hasn't shrunk linearly at 2.1% per annum, but the CAGR is a useful estimate of the historical rate of change.
We struggle to make a case for buying Spark New Zealand for its dividend, given that payments have shrunk over the past ten years.
Dividend Growth Potential
With a relatively unstable dividend, it's even more important to see if earnings per share (EPS) are growing. Why take the risk of a dividend getting cut, unless there's a good chance of bigger dividends in future? Spark New Zealand has grown its earnings per share at 7.1% per annum over the past five years. Although per-share earnings are growing at a credible rate, virtually all of the income is being paid out as dividends to shareholders. This is okay, but may limit growth in the company's future dividend payments.
Conclusion
Dividend investors should always want to know if a) a company's dividends are affordable, b) if there is a track record of consistent payments, and c) if the dividend is capable of growing. It's a concern to see that the company paid out such a high percentage of its earnings and cashflow as dividends. Second, earnings growth has been ordinary, and its history of dividend payments is chequered - having cut its dividend at least once in the past. In this analysis, Spark New Zealand doesn't shape up too well as a dividend stock. We'd find it hard to look past the flaws, and would not be inclined to think of it as a reliable dividend-payer.
Earnings growth generally bodes well for the future value of company dividend payments. See if the 10 Spark New Zealand analysts we track are forecasting continued growth with our free report on analyst estimates for the company.
We have also put together a list of global stocks with a market capitalisation above $1bn and yielding more 3%.
We aim to bring you long-term focused research analysis driven by fundamental data. Note that our analysis may not factor in the latest price-sensitive company announcements or qualitative material.
If you spot an error that warrants correction, please contact the editor at editorial-team@simplywallst.com. This article by Simply Wall St is general in nature. It does not constitute a recommendation to buy or sell any stock, and does not take account of your objectives, or your financial situation. Simply Wall St has no position in the stocks mentioned. Thank you for reading.
