
 Yahoo Finance
 Spark New Zealand (NZSE:SPK) shareholders have earned a 14% CAGR over the last five years
Generally speaking the aim of active stock picking is to find companies that provide returns that are superior to the market average. And the truth is, you can make significant gains if you buy good quality businesses at the right price. For example, the Spark New Zealand Limited (NZSE:SPK) share price is up 40% in the last 5 years, clearly besting the market return of around 5.5% (ignoring dividends). On the other hand, the more recent gains haven't been so impressive, with shareholders gaining just 15% , including dividends .
Now it's worth having a look at the company's fundamentals too, because that will help us determine if the long term shareholder return has matched the performance of the underlying business.
Check out our latest analysis for Spark New Zealand
To paraphrase Benjamin Graham: Over the short term the market is a voting machine, but over the long term it's a weighing machine. One imperfect but simple way to consider how the market perception of a company has shifted is to compare the change in the earnings per share (EPS) with the share price movement.
During five years of share price growth, Spark New Zealand actually saw its EPS drop 0.8% per year.
So it's hard to argue that the earnings per share are the best metric to judge the company, as it may not be optimized for profits at this point. Since the change in EPS doesn't seem to correlate with the change in share price, it's worth taking a look at other metrics.
In fact, the dividend has increased over time, which is a positive. It could be that the company is reaching maturity and dividend investors are buying for the yield.
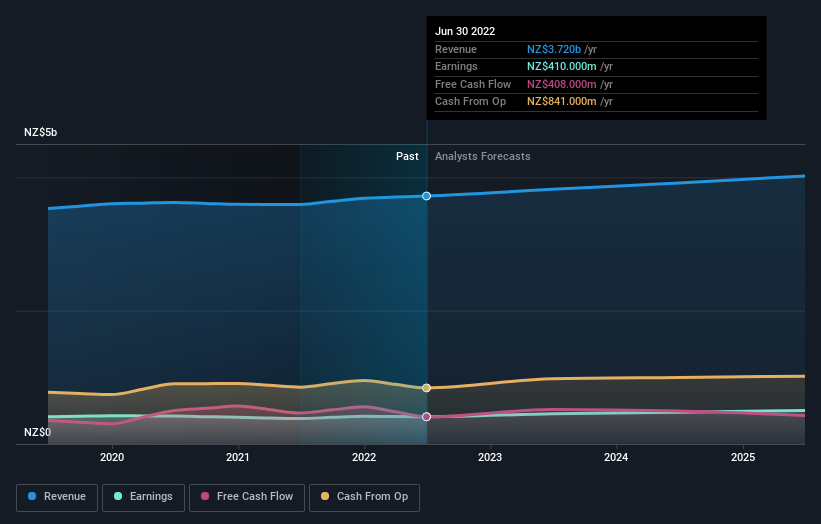
The company's revenue and earnings (over time) are depicted in the image below (click to see the exact numbers).
It's probably worth noting we've seen significant insider buying in the last quarter, which we consider a positive. That said, we think earnings and revenue growth trends are even more important factors to consider. So it makes a lot of sense to check out what analysts think Spark New Zealand will earn in the future (free profit forecasts).
What About Dividends?
As well as measuring the share price return, investors should also consider the total shareholder return (TSR). Whereas the share price return only reflects the change in the share price, the TSR includes the value of dividends (assuming they were reinvested) and the benefit of any discounted capital raising or spin-off. Arguably, the TSR gives a more comprehensive picture of the return generated by a stock. As it happens, Spark New Zealand's TSR for the last 5 years was 95%, which exceeds the share price return mentioned earlier. The dividends paid by the company have thusly boosted the total shareholder return.
A Different Perspective
We're pleased to report that Spark New Zealand shareholders have received a total shareholder return of 15% over one year. Of course, that includes the dividend. Since the one-year TSR is better than the five-year TSR (the latter coming in at 14% per year), it would seem that the stock's performance has improved in recent times. In the best case scenario, this may hint at some real business momentum, implying that now could be a great time to delve deeper. I find it very interesting to look at share price over the long term as a proxy for business performance. But to truly gain insight, we need to consider other information, too. Case in point: We've spotted 2 warning signs for Spark New Zealand you should be aware of, and 1 of them doesn't sit too well with us.
There are plenty of other companies that have insiders buying up shares. You probably do not want to miss this free list of growing companies that insiders are buying.
Please note, the market returns quoted in this article reflect the market weighted average returns of stocks that currently trade on NZ exchanges.
Have feedback on this article? Concerned about the content? Get in touch with us directly. Alternatively, email editorial-team (at) simplywallst.com.
This article by Simply Wall St is general in nature. We provide commentary based on historical data and analyst forecasts only using an unbiased methodology and our articles are not intended to be financial advice. It does not constitute a recommendation to buy or sell any stock, and does not take account of your objectives, or your financial situation. We aim to bring you long-term focused analysis driven by fundamental data. Note that our analysis may not factor in the latest price-sensitive company announcements or qualitative material. Simply Wall St has no position in any stocks mentioned.
Join A Paid User Research Session
You’ll receive a US$30 Amazon Gift card for 1 hour of your time while helping us build better investing tools for the individual investors like yourself. Sign up here
