
 Yahoo Finance
 Stella-Jones Inc.'s (TSE:SJ) Stock Has Been Sliding But Fundamentals Look Strong: Is The Market Wrong?
With its stock down 13% over the past three months, it is easy to disregard Stella-Jones (TSE:SJ). However, stock prices are usually driven by a company’s financial performance over the long term, which in this case looks quite promising. In this article, we decided to focus on Stella-Jones' ROE.
Return on Equity or ROE is a test of how effectively a company is growing its value and managing investors’ money. In short, ROE shows the profit each dollar generates with respect to its shareholder investments.
See our latest analysis for Stella-Jones
How To Calculate Return On Equity?
Return on equity can be calculated by using the formula:
Return on Equity = Net Profit (from continuing operations) ÷ Shareholders' Equity
So, based on the above formula, the ROE for Stella-Jones is:
15% = CA$217m ÷ CA$1.4b (Based on the trailing twelve months to March 2022).
The 'return' is the profit over the last twelve months. Another way to think of that is that for every CA$1 worth of equity, the company was able to earn CA$0.15 in profit.
What Is The Relationship Between ROE And Earnings Growth?
We have already established that ROE serves as an efficient profit-generating gauge for a company's future earnings. Depending on how much of these profits the company reinvests or "retains", and how effectively it does so, we are then able to assess a company’s earnings growth potential. Assuming everything else remains unchanged, the higher the ROE and profit retention, the higher the growth rate of a company compared to companies that don't necessarily bear these characteristics.
Stella-Jones' Earnings Growth And 15% ROE
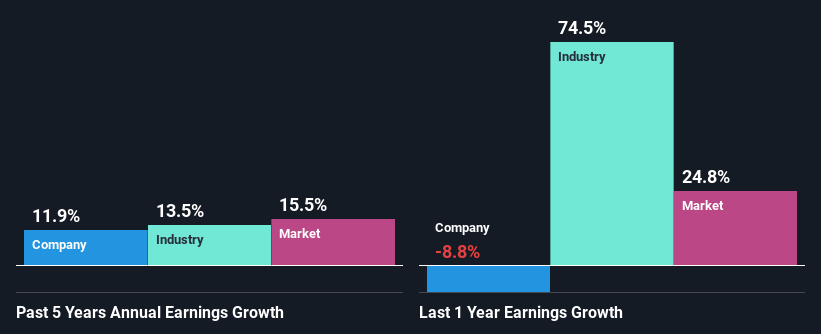
At first glance, Stella-Jones seems to have a decent ROE. Yet, the fact that the company's ROE is lower than the industry average of 24% does temper our expectations. Stella-Jones was still able to see a decent net income growth of 12% over the past five years. Therefore, the growth in earnings could probably have been caused by other variables. For instance, the company has a low payout ratio or is being managed efficiently. Bear in mind, the company does have a respectable level of ROE. It is just that the industry ROE is higher. So this also provides some context to the earnings growth seen by the company.
As a next step, we compared Stella-Jones' net income growth with the industry and found that the company has a similar growth figure when compared with the industry average growth rate of 13% in the same period.
Earnings growth is an important metric to consider when valuing a stock. What investors need to determine next is if the expected earnings growth, or the lack of it, is already built into the share price. By doing so, they will have an idea if the stock is headed into clear blue waters or if swampy waters await. What is SJ worth today? The intrinsic value infographic in our free research report helps visualize whether SJ is currently mispriced by the market.
Is Stella-Jones Efficiently Re-investing Its Profits?
Stella-Jones' three-year median payout ratio to shareholders is 22% (implying that it retains 78% of its income), which is on the lower side, so it seems like the management is reinvesting profits heavily to grow its business.
Additionally, Stella-Jones has paid dividends over a period of at least ten years which means that the company is pretty serious about sharing its profits with shareholders. Based on the latest analysts' estimates, we found that the company's future payout ratio over the next three years is expected to hold steady at 22%. As a result, Stella-Jones' ROE is not expected to change by much either, which we inferred from the analyst estimate of 14% for future ROE.
Summary
In total, we are pretty happy with Stella-Jones' performance. Particularly, we like that the company is reinvesting heavily into its business at a moderate rate of return. Unsurprisingly, this has led to an impressive earnings growth. That being so, a study of the latest analyst forecasts show that the company is expected to see a slowdown in its future earnings growth. To know more about the latest analysts predictions for the company, check out this visualization of analyst forecasts for the company.
Have feedback on this article? Concerned about the content? Get in touch with us directly. Alternatively, email editorial-team (at) simplywallst.com.
This article by Simply Wall St is general in nature. We provide commentary based on historical data and analyst forecasts only using an unbiased methodology and our articles are not intended to be financial advice. It does not constitute a recommendation to buy or sell any stock, and does not take account of your objectives, or your financial situation. We aim to bring you long-term focused analysis driven by fundamental data. Note that our analysis may not factor in the latest price-sensitive company announcements or qualitative material. Simply Wall St has no position in any stocks mentioned.
