
 Yahoo Finance
 Stryker (NYSE:SYK) Might Be Having Difficulty Using Its Capital Effectively
If you're not sure where to start when looking for the next multi-bagger, there are a few key trends you should keep an eye out for. One common approach is to try and find a company with returns on capital employed (ROCE) that are increasing, in conjunction with a growing amount of capital employed. Put simply, these types of businesses are compounding machines, meaning they are continually reinvesting their earnings at ever-higher rates of return. However, after investigating Stryker (NYSE:SYK), we don't think it's current trends fit the mold of a multi-bagger.
Understanding Return On Capital Employed (ROCE)
Just to clarify if you're unsure, ROCE is a metric for evaluating how much pre-tax income (in percentage terms) a company earns on the capital invested in its business. To calculate this metric for Stryker, this is the formula:
Return on Capital Employed = Earnings Before Interest and Tax (EBIT) ÷ (Total Assets - Current Liabilities)
0.11 = US$3.6b ÷ (US$36b - US$4.4b) (Based on the trailing twelve months to June 2022).
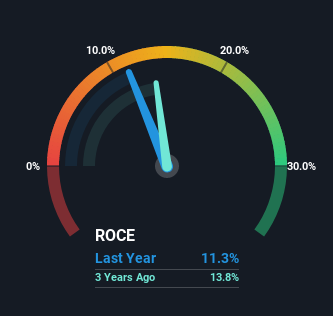
So, Stryker has an ROCE of 11%. In absolute terms, that's a satisfactory return, but compared to the Medical Equipment industry average of 9.2% it's much better.
View our latest analysis for Stryker
In the above chart we have measured Stryker's prior ROCE against its prior performance, but the future is arguably more important. If you'd like to see what analysts are forecasting going forward, you should check out our free report for Stryker.
So How Is Stryker's ROCE Trending?
On the surface, the trend of ROCE at Stryker doesn't inspire confidence. To be more specific, ROCE has fallen from 15% over the last five years. Meanwhile, the business is utilizing more capital but this hasn't moved the needle much in terms of sales in the past 12 months, so this could reflect longer term investments. It's worth keeping an eye on the company's earnings from here on to see if these investments do end up contributing to the bottom line.
The Key Takeaway
To conclude, we've found that Stryker is reinvesting in the business, but returns have been falling. Although the market must be expecting these trends to improve because the stock has gained 59% over the last five years. However, unless these underlying trends turn more positive, we wouldn't get our hopes up too high.
If you want to know some of the risks facing Stryker we've found 2 warning signs (1 can't be ignored!) that you should be aware of before investing here.
While Stryker may not currently earn the highest returns, we've compiled a list of companies that currently earn more than 25% return on equity. Check out this free list here.
Have feedback on this article? Concerned about the content? Get in touch with us directly. Alternatively, email editorial-team (at) simplywallst.com.
This article by Simply Wall St is general in nature. We provide commentary based on historical data and analyst forecasts only using an unbiased methodology and our articles are not intended to be financial advice. It does not constitute a recommendation to buy or sell any stock, and does not take account of your objectives, or your financial situation. We aim to bring you long-term focused analysis driven by fundamental data. Note that our analysis may not factor in the latest price-sensitive company announcements or qualitative material. Simply Wall St has no position in any stocks mentioned.
Join A Paid User Research Session
You’ll receive a US$30 Amazon Gift card for 1 hour of your time while helping us build better investing tools for the individual investors like yourself. Sign up here
