
 Yahoo Finance
 Taking A Look At Universal Store Holdings Limited's (ASX:UNI) ROE
While some investors are already well versed in financial metrics (hat tip), this article is for those who would like to learn about Return On Equity (ROE) and why it is important. To keep the lesson grounded in practicality, we'll use ROE to better understand Universal Store Holdings Limited (ASX:UNI).
Return on equity or ROE is an important factor to be considered by a shareholder because it tells them how effectively their capital is being reinvested. In simpler terms, it measures the profitability of a company in relation to shareholder's equity.
Check out our latest analysis for Universal Store Holdings
How Is ROE Calculated?
Return on equity can be calculated by using the formula:
Return on Equity = Net Profit (from continuing operations) ÷ Shareholders' Equity
So, based on the above formula, the ROE for Universal Store Holdings is:
24% = AU$24m ÷ AU$103m (Based on the trailing twelve months to June 2021).
The 'return' is the income the business earned over the last year. That means that for every A$1 worth of shareholders' equity, the company generated A$0.24 in profit.
Does Universal Store Holdings Have A Good ROE?
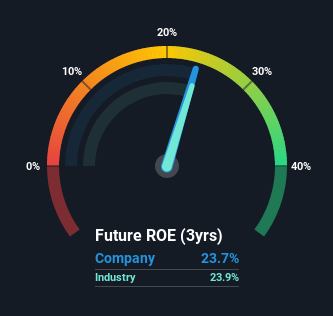
By comparing a company's ROE with its industry average, we can get a quick measure of how good it is. Importantly, this is far from a perfect measure, because companies differ significantly within the same industry classification. If you look at the image below, you can see Universal Store Holdings has a similar ROE to the average in the Specialty Retail industry classification (24%).
That isn't amazing, but it is respectable. Although the ROE is similar to the industry, we should still perform further checks to see if the company's ROE is being boosted by high debt levels. If so, this increases its exposure to financial risk. Our risks dashboardshould have the 2 risks we have identified for Universal Store Holdings.
How Does Debt Impact Return On Equity?
Virtually all companies need money to invest in the business, to grow profits. The cash for investment can come from prior year profits (retained earnings), issuing new shares, or borrowing. In the first and second cases, the ROE will reflect this use of cash for investment in the business. In the latter case, the use of debt will improve the returns, but will not change the equity. Thus the use of debt can improve ROE, albeit along with extra risk in the case of stormy weather, metaphorically speaking.
Combining Universal Store Holdings' Debt And Its 24% Return On Equity
Universal Store Holdings has a debt to equity ratio of 0.14, which is far from excessive. When I see a high ROE, fuelled by only modest debt, I suspect the business is high quality. Conservative use of debt to boost returns is usually a good move for shareholders, though it does leave the company more exposed to interest rate rises.
Summary
Return on equity is useful for comparing the quality of different businesses. In our books, the highest quality companies have high return on equity, despite low debt. All else being equal, a higher ROE is better.
But when a business is high quality, the market often bids it up to a price that reflects this. It is important to consider other factors, such as future profit growth -- and how much investment is required going forward. So you might want to take a peek at this data-rich interactive graph of forecasts for the company.
Of course, you might find a fantastic investment by looking elsewhere. So take a peek at this free list of interesting companies.
This article by Simply Wall St is general in nature. We provide commentary based on historical data and analyst forecasts only using an unbiased methodology and our articles are not intended to be financial advice. It does not constitute a recommendation to buy or sell any stock, and does not take account of your objectives, or your financial situation. We aim to bring you long-term focused analysis driven by fundamental data. Note that our analysis may not factor in the latest price-sensitive company announcements or qualitative material. Simply Wall St has no position in any stocks mentioned.
Have feedback on this article? Concerned about the content? Get in touch with us directly. Alternatively, email editorial-team (at) simplywallst.com.
