
 Yahoo Finance
 TC Energy (TRP) Q1 Earnings in Line With Estimates, Sales Beat
TC Energy TRP reported first-quarter 2023 adjusted earnings of 89 cents per share, which is in line with the Zacks Consensus Estimate. The bottom line marginally increased from the year-ago quarter’s profit of 88 cents.
The company reported comparable EBITDA of about C$2.77 billion compared with C$2.39 billion in the prior-year period.
Revenues of $2.90 billion beat the Zacks Consensus Estimate of $2.73 billion. The figure also increased 5.1% year over year. This outperformance could be attributed to the strong results of the Canadian Natural Gas Pipelines, Mexico Natural Gas Pipelines, and Power and Storage segments.
TRP’s board of directors announced a quarterly dividend of 93 Canadian cents per common share for the quarter ending Jun 30, 2023. The dividend is payable on Jul 31, 2023, to shareholders of record at the close of the business on Jun 30, 2022.
TC Energy Corporation Price, Consensus and EPS Surprise
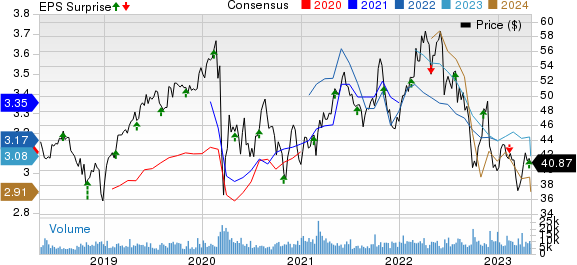
TC Energy Corporation price-consensus-eps-surprise-chart | TC Energy Corporation Quote
Segmental Information
Canadian Natural Gas Pipelines reported a comparable EBITDA of C$740 million, up 14.9% from the year-ago quarter’s level. This increase was largely due to the impact of higher flow-through costs on Canadian rate-regulated pipelines and increased rate-base earnings on the NGTL System.
U.S. Natural Gas Pipelines’ comparable EBITDA of C$1.3 billion reflects an 8.3% increase from the prior-year quarter’s recorded number. This upside was due to higher earnings from ANR following the FERC-approved settlement for an increase in transportation rates, effective August 2022. The improvement can also be attributed to growth projects placed in service, and higher realized earnings related to the U.S. natural gas marketing business, partially offset by higher operational costs.
Mexico Natural Gas Pipelines reported comparable EBITDA of C$172 million, up 16.2% from the year-ago quarter’s figure of C$148 million. The upside was primarily due to the north section of the Villa de Reyes pipeline (VdR North) and the east section of the Tula pipeline (Tula East) that were placed into commercial service in the third quarter of 2022. This was partially offset by an equity income loss from Sur de Texas primarily due to peso-denominated financial exposure.
The Liquids Pipelines unit’s comparable EBITDA of C$317 million deteriorated from the prior-year quarter’s level of C$329 million. This downtrend can be attributed to lower uncontracted volumes in the Keystone Pipeline System in relation to the Milepost 14 incident. It was also due to lower rates and volumes on the U.S. Gulf Coast section of the pipeline, partially offset by higher long-haul contracted volumes from the 2019 Open Season that were commercialized in 2022.
Power and Storage registered a comparable EBITDA of C$281 million, up 79% from the year-ago quarter’s level of C$157 million. The uptrend was due to increased contributions from Bruce Power due to a higher contract price and fewer planned outage days. This was partially offset by realized losses on funds invested for post-retirement benefits, as well as increased earnings from Canadian Power due to higher realized power prices.
Expenditure and Balance Sheet
As of Mar 31, 2023, TC Energy’s capital investments amounted to C$3.03 billion.
TRP had cash and cash equivalents worth C$3.85 billion and long-term debt of C$46.25 billion, with a debt-to-capitalization of 57.2%.
Key Updates
The company expects to spend C$34 billion on capital programs in 2023. It continues to anticipate capital spending in the range of C$11.5-C$12.0 billion for the same year. Common share dividend is projected at an annual rate of 3-5%.
TC Energy projects 700 MMcf/d of additional market access with an incremental 500 MMcf/d in the second quarter of 2023.
It expects comparable EBITDA growth of 5-7% in 2023, with higher earnings per common share.
Bruce Power Unit 3 will be removed from service on Mar 1, 2023, to begin its Major Component Replacement outage. A return to service is expected in 2026.
Zacks Rank and Key Picks
Currently, TC Energy carries a Zacks Rank #3 (Hold). Some better-ranked stocks for investors interested in the energy sector are CVR Energy CVI, sporting a Zacks Rank #1 (Strong Buy), and Marathon Petroleum MPC and Ranger Energy Services RNGR, each holding a Zacks Rank #2 (Buy) at present. You can see the complete list of today’s Zacks #1 Rank stocks here.
CVR Energy: CVI is worth approximately $2.63 billion. CVI currently pays investors $2.00 per share, or 7.63%, on an annual basis.
The company currently has a forward P/E ratio of 6.59. In comparison, its industry has an average forward P/E of 8.60, which means CVI is trading at a discount to the group.
Marathon Petroleum: MPC is valued at around $58.02 billion. It delivered an average earnings surprise of 20.91% for the last four quarters and its current dividend yield is 2.30%.
The company currently has a forward P/E ratio of 6.36. In comparison, its industry has an average forward P/E of 9.10, which means MPC is trading at a discount to the group.
Ranger Energy Services: RNGR is valued at around $242.99 million. In the past year, its shares have gained 16.8%.
Ranger Energy Services currently has a forward P/E ratio of 5.30. In comparison, its industry has an average forward P/E of 11.60, which means RNGR is trading at a discount to the group.
Want the latest recommendations from Zacks Investment Research? Today, you can download 7 Best Stocks for the Next 30 Days. Click to get this free report
CVR Energy Inc. (CVI) : Free Stock Analysis Report
TC Energy Corporation (TRP) : Free Stock Analysis Report
Marathon Petroleum Corporation (MPC) : Free Stock Analysis Report
Ranger Energy Services, Inc. (RNGR) : Free Stock Analysis Report
