
 Yahoo Finance
 Technical Update For EUR/USD, USD/JPY, USD/CAD & NZD/USD: 21.11.2017
EUR/USD
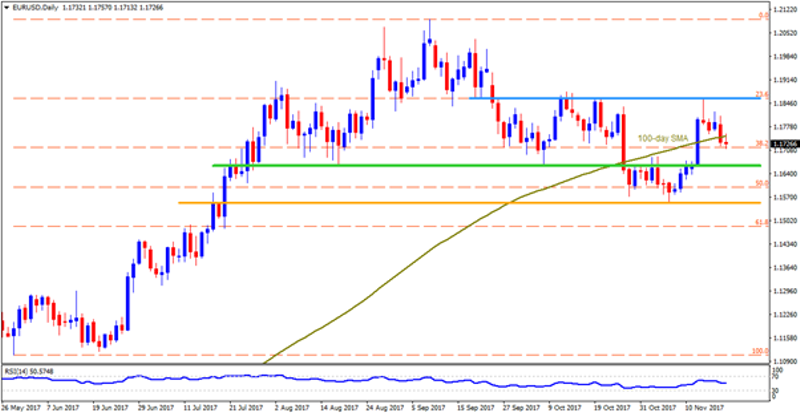
With the 1.1860-65 horizontal-line again restricting the EURUSD’s upside, the pair dipped below 100-day SMA on Monday and is presently aiming to re-test the 1.1660-65 support-zone. Should the pair continue declining below 1.1660, the 1.1620 and the 1.1580 are likely consecutive rests that it may avail ahead of meeting the 1.1550-55 area, which if broken could enable the Bears to demand 1.1500 and the 1.1485 support-levels. On the contrary, a daily closing above 100-day SMA level of 1.1750 can trigger the pair’s pullback to 1.1820 prior to making it confront the 1.1860-65 region. Moreover, a D1 close beyond 1.1865 increases chances of the pair’s rally to 1.1910 and to the 1.1980 resistances.
USD/JPY

USDJPY’s latest bounce couldn’t clear 50-day SMA and the same confines the pair’s current advances, indicating likeliness of its dip to 112.00 round-figure; though, the 100-day & 200-day SMA confluence, near 111.75-70, might restrict the quote’s additional downside. If at all prices refrain to respect the 111.70, it seems wise to target 111.00 and the 110.70 while being short. Meanwhile, pair’s ability to clear the 50-day SMA level of 112.80 could escalate its recovery to 113.20 and then to the 113.55 resistances. Given the pair’s successful trading above 113.55, the 114.00 could offer an intermediate halt during its northward trajectory to conquer the 114.35-45 region.
USD/CAD
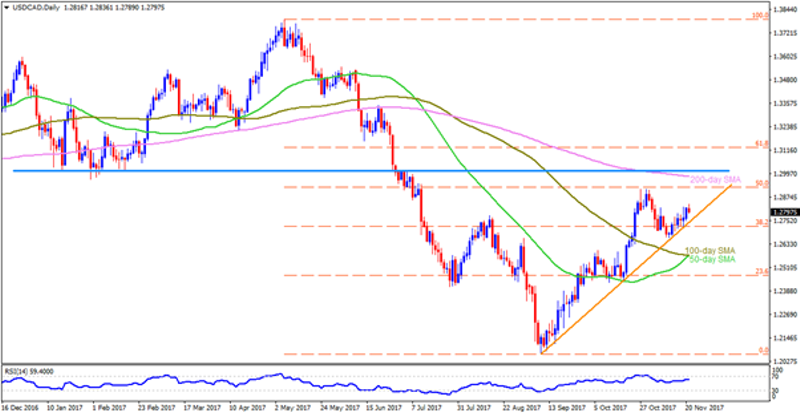
Even if the 1.2830-35 recently activated the USDCAD’s pullback, a ten-week old ascending trend-line, at 1.2740 now, may keep favoring the pair’s north-run, if not then an immediate dip to 1.2690 and then to 1.2660 can well be witnessed on the chart. However, the 1.2630 is the only downside number that could please sellers during post-1.2660 break as the 50-day & 100-day SMA area of 1.2575-70 might challenge the selling bias then after. On the upside, break of 1.2835 may have to pass through the 1.2855, the 1.2920 and the 1.2940 prior to aiming the 200-day SMA level of 1.2980 and the 1.3005-15 horizontal-line. If at all the Bulls manage to clear 1.3015 on a daily closing basis, the 1.3050, the 1.3075 and the 1.3100 can entertain them.
NZD/USD
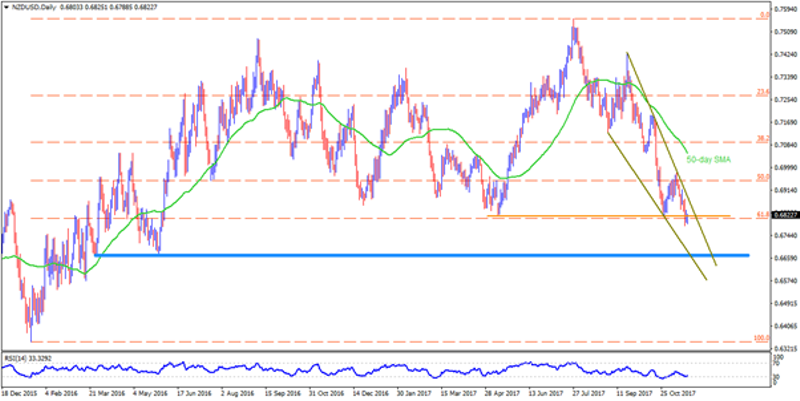
Break of 0.6815-20 didn’t pay well to the NZDUSD Bears as the quote flashes 0.6820-25 again on the chart; though, a Daily closing beyond the same is required for the pair to challenge the resistance-line of short-term “Falling-Wedge”, around 0.6890, which if broken could trigger the pair’s north-run to 0.6930, the 0.6980 and then to the 0.7005 consecutive resistances. Should prices fail to close above 0.6820, the 0.6775 and the 0.6730 may act as rests for the pair, breaking which 0.6710 and the 0.6675-65 can appear in sellers’ radar. Additionally, pair’s sustained trading beneath 0.6665 could highlight the 0.6560 support.
Cheers and Safe Trading,
Anil Panchal
This article was originally posted on FX Empire
More From FXEMPIRE:
AUD/USD Forex Technical Analysis – November 21, 2017 Forecast
Technical Update For EUR/USD, USD/JPY, USD/CAD & NZD/USD: 21.11.2017
Correction on the EURUSD is bigger than expected. AUDJPY with a nice bearish setup
E-mini S&P 500 Index (ES) Futures Technical Analysis – November 21, 2017 Forecast
US Dollar Index (DX) Futures Technical Analysis – November 21, 2017 Forecast
Comex High Grade Copper Price Futures (HG) Technical Analysis – November 21, 2017 Forecast
