
 Yahoo Finance
 Technical Update For USD/CAD, EUR/CAD, NZD/CAD & CAD/CHF: 26.07.2018
USD/CAD

USDCAD’s dip beneath the 50-day SMA & four-month old horizontal-region can’t be termed as strong Bearish signal as 100-day SMA level of 1.2955, an upward slanting TL stretched since early-February, at 1.2890, and the 1.2805 figure comprising 200-day SMA, still stand tall to challenge sellers. In case if the pair closes below 1.2805 on D1 basis, it can then aim for 1.2740 and the 1.2700 support-levels. On the upside, the 1.3045-50 horizontal-line and the 50-day SMA level of 1.3090 could try limiting the pair’s near-term advances, breaking which the 1.3110, the 1.3160 and the 1.3210 might offer intermediate halts before highlighting the 1.3270 trend-line barrier. Should the 1.3270 fails to disappoint buyers, the 1.3320-30 and the 1.3385 may appear in their radar to target.
EUR/CAD
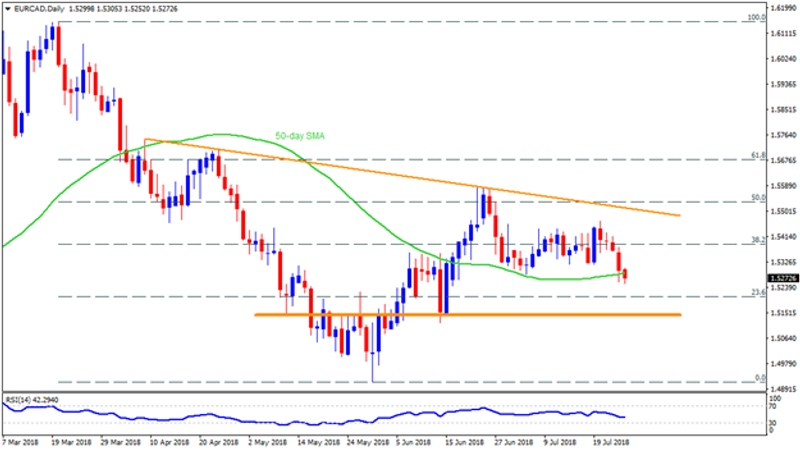
Given the EURCAD’s daily closing below 50-day SMA, the 1.5200 is likely to appear on the chart but the 1.5140-50 region can confine the pair’s additional declines. Though, pair’s sustained downturn past-1.5140 can avail the 1.5060 and the 1.5000 mark as buffers prior to diverting market attention to recent low of 1.4915. If at all the quote closes above 50-day SMA level of 1.5290, it can revisit the 1.5320 and the 1.5360 resistances ahead of pushing bulls to aim for the 1.5440, the 1.5470 and the 1.5515 trend-line. Moreover, pair’s successful trading beyond 1.5515 may not hesitate questioning the strength of the 1.5580, the 1.5640 and the 1.5710 resistances.
NZD/CAD
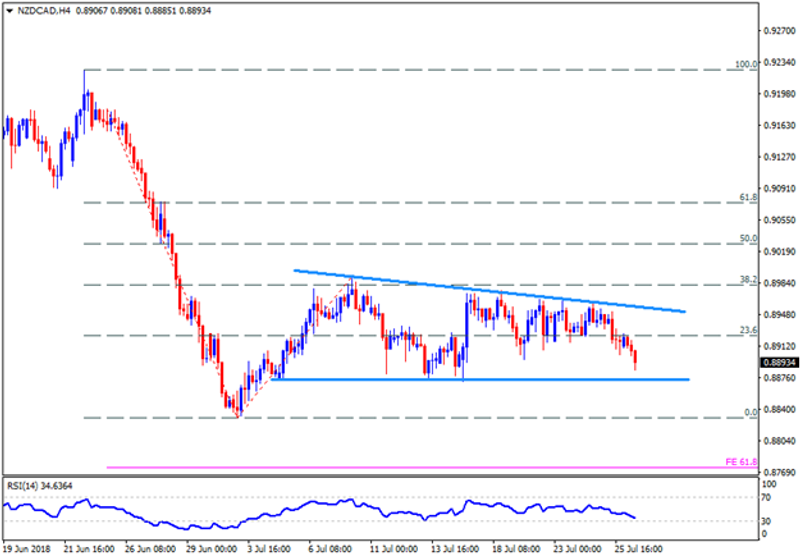
Having reversed from resistance-line of short-term descending triangle formation, the NZDCAD seems all set to re-test the 0.8875-70 horizontal-support, which if fail to restrict the pair’s south-run can drag it to 0.8860 and the 0.8830 rest-points. Also, pair’s refrain to respect the 0.8830 mark can make it vulnerable to plunge towards 61.8% FE level of 0.8770. Alternatively, the 0.8915 and the 0.8950 can please counter-trend traders during the pair’s U-turn but the aforementioned TL, at 0.8960, may tame its further advances. However, break of 0.8960 could theoretically confirm the pair’s rise to the 0.9100 number with the 0.9000 and the 0.9065 being intermediate stops.
CAD/CHF

Unless clearing the 200-day SMA level of 0.7615 on a daily closing basis, the CADCHF can’t be termed strong enough to aim for the 0.7665 resistance, breaking which 0.7700-0.7705 becomes crucial to watch. In case the pair conquers the 0.7705 hurdle, the 0.7740, the 0.7765 and the 0.7805 might lure the buyers. Meanwhile, inability to surpass the 0.7615 may reprint 0.7585 on the chart while immediate ascending TL figure of 0.7535 can restrict the pair’s following downside. Assuming that the prices drop below 0.7535, then the 0.7510, the 0.7445 trend-line number and the 0.7400 may please the Bears.
This article was originally posted on FX Empire
