
 Yahoo Finance
 TEGNA's (TGNA) Q2 Earnings and Revenues Surpass Estimates

TEGNA Inc. TGNA reported second-quarter 2018 non-GAAP earnings of 36 cents per share, which beat the Zacks Consensus Estimate by a penny. The figure increased 24.1% on a year-over-year basis and 9.1% sequentially.
On a GAAP basis, revenues increased 7.1% year over year to $524.1 million, which came ahead of the Zacks Consensus Estimate of $517 million. Top-line growth was driven by continued increase in total paid subscribers, mainly OTT subscribers, and political revenues.
TEGNA reported adjusted revenues of $498.4 million, which excludes political revenues and discontinued digital business. The figure also reflects year-over-year growth of 4.8%.
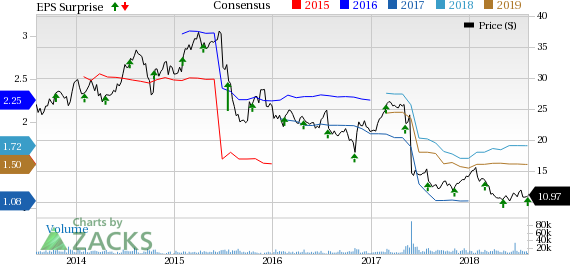
TEGNA Inc. Price, Consensus and EPS Surprise
TEGNA Inc. Price, Consensus and EPS Surprise | TEGNA Inc. Quote
Top Line in Detail
TEGNA reports revenues in four categories.
Advertising and Marketing Services (53.8% of total revenues): The company generated $281.8 million of revenues from this category, down 4.9% on a year-over-year basis. The year-over-year decline in verticals such as retail, automotive and restaurants was offset by growth in entertainment, services and medical. Moreover, premature lease termination with Gannett on Jun 1, 2017, had an unfavorable effect of $6.2 million on revenues.
Subscription (39.9%): This category generated $209.4 million revenues in the reported quarter, up 16.1% from the year-ago quarter. This was driven by contract rate hike and higher paid subscribers of both MVPD and new virtual MVPD services. Moreover, subscribers and revenues from OTT streaming services increased in second quarter.
Political (4.9%): This category generated $25.7 million of revenues, which increased 245.3% from the year-ago period. The year-over-year growth was primarily driven by solid political advertising revenues of $18 million.
Other (1.4%): TEGNA generated $7.2 million of revenues from this category, up 36.8% year over year.
Operating Details
Reported operating expenses (70.6% of total revenues) in second quarter were $369.9 million, up 9% year over year due to increased programming fees and Premion investments.
Operating margin came in 29.4%, which contracted 130 basis points (bps) from the year-ago quarter.
Further, adjusted EBITDA was $169.6 million, down 1.1% year over year.
Balance Sheet & Cash Flows
As of Jun 30, total cash was $24.5 million, which increased from $8.3 million as of Mar 31. Also, long-term debt outstanding was $3.1 billion compared with $3 billion in the last quarter.
In the second quarter, TEGNA generated $102.6 million of cash from operations compared with $103.1 million in the prior-year quarter. Free cash flow was $92.6 million compared with $71.4 million in the year-ago period.
Guidance
For third-quarter 2018, TEGNA expects revenues to increase in mid-teens on a year-over basis, primarily driven by subscription, political and Premion revenues.
Management raised Premion revenue guidance, which excludes political revenues, to $75 million from the earlier guided figure of $60 million.
For 2018, the company raised its subscription revenue guidance and expects it to be up in mid-teens.
Zacks Rank & Stocks to Consider
TEGNA currently carries a Zacks Rank #3 (Hold).
Some better-ranked stocks in the consumer discretionary sector are Weight Watchers International WTW, Glu Mobile GLUU and Penn National PENN. While Weight Watchers International sports a Zacks Rank #1 (Strong Buy), Glu Mobile and Penn National carry a Zacks Rank #2 (Buy). You can see the complete list of today’s Zacks #1 Rank stocks here.
Long-term earnings growth rate for Weight Watchers International, Glu Mobile and Penn National is 17.5%, 15% and 10%, respectively.
More Stock News: This Is Bigger than the iPhone!
It could become the mother of all technological revolutions. Apple sold a mere 1 billion iPhones in 10 years but a new breakthrough is expected to generate more than 27 billion devices in just 3 years, creating a $1.7 trillion market.
Zacks has just released a Special Report that spotlights this fast-emerging phenomenon and 6 tickers for taking advantage of it. If you don't buy now, you may kick yourself in 2020.
Click here for the 6 trades >>
Want the latest recommendations from Zacks Investment Research? Today, you can download 7 Best Stocks for the Next 30 Days. Click to get this free report
Penn National Gaming, Inc. (PENN) : Free Stock Analysis Report
TEGNA Inc. (TGNA) : Free Stock Analysis Report
Glu Mobile Inc. (GLUU) : Free Stock Analysis Report
Weight Watchers International Inc (WTW) : Free Stock Analysis Report
To read this article on Zacks.com click here.
Zacks Investment Research
