
 Yahoo Finance
 Should You Be Tempted To Sell Fisher & Paykel Healthcare Corporation Limited (NZSE:FPH) Because Of Its P/E Ratio?

Want to participate in a short research study? Help shape the future of investing tools and receive a $20 prize!
This article is for investors who would like to improve their understanding of price to earnings ratios (P/E ratios). To keep it practical, we’ll show how Fisher & Paykel Healthcare Corporation Limited’s (NZSE:FPH) P/E ratio could help you assess the value on offer. Fisher & Paykel Healthcare has a P/E ratio of 37.07, based on the last twelve months. That corresponds to an earnings yield of approximately 2.7%.
Check out our latest analysis for Fisher & Paykel Healthcare
How Do I Calculate A Price To Earnings Ratio?
The formula for price to earnings is:
Price to Earnings Ratio = Share Price ÷ Earnings per Share (EPS)
Or for Fisher & Paykel Healthcare:
P/E of 37.07 = NZ$13.38 ÷ NZ$0.36 (Based on the trailing twelve months to September 2018.)
Is A High Price-to-Earnings Ratio Good?
A higher P/E ratio implies that investors pay a higher price for the earning power of the business. That isn’t necessarily good or bad, but a high P/E implies relatively high expectations of what a company can achieve in the future.
How Growth Rates Impact P/E Ratios
P/E ratios primarily reflect market expectations around earnings growth rates. Earnings growth means that in the future the ‘E’ will be higher. That means even if the current P/E is high, it will reduce over time if the share price stays flat. A lower P/E should indicate the stock is cheap relative to others — and that may attract buyers.
It’s great to see that Fisher & Paykel Healthcare grew EPS by 19% in the last year. And it has bolstered its earnings per share by 16% per year over the last five years. This could arguably justify a relatively high P/E ratio.
How Does Fisher & Paykel Healthcare’s P/E Ratio Compare To Its Peers?
The P/E ratio essentially measures market expectations of a company. You can see in the image below that the average P/E (22.3) for companies in the medical equipment industry is lower than Fisher & Paykel Healthcare’s P/E.
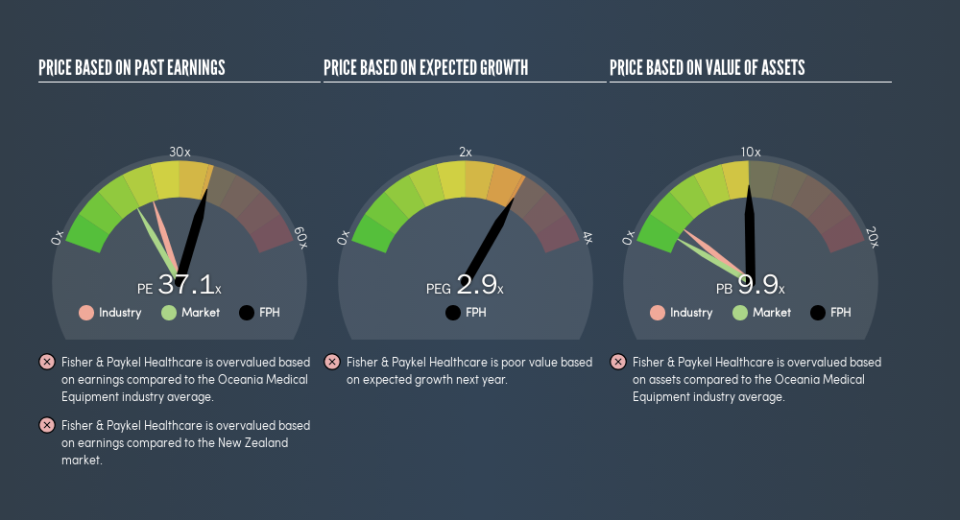
Fisher & Paykel Healthcare’s P/E tells us that market participants think the company will perform better than its industry peers, going forward. Shareholders are clearly optimistic, but the future is always uncertain. So further research is always essential. I often monitor director buying and selling.
A Limitation: P/E Ratios Ignore Debt and Cash In The Bank
The ‘Price’ in P/E reflects the market capitalization of the company. That means it doesn’t take debt or cash into account. Hypothetically, a company could reduce its future P/E ratio by spending its cash (or taking on debt) to achieve higher earnings.
Spending on growth might be good or bad a few years later, but the point is that the P/E ratio does not account for the option (or lack thereof).
Fisher & Paykel Healthcare’s Balance Sheet
The extra options and safety that comes with Fisher & Paykel Healthcare’s NZ$15m net cash position means that it deserves a higher P/E than it would if it had a lot of net debt.
The Bottom Line On Fisher & Paykel Healthcare’s P/E Ratio
Fisher & Paykel Healthcare’s P/E is 37.1 which is above average (17.3) in the NZ market. Its strong balance sheet gives the company plenty of resources for extra growth, and it has already proven it can grow. Therefore it seems reasonable that the market would have relatively high expectations of the company
Investors should be looking to buy stocks that the market is wrong about. As value investor Benjamin Graham famously said, ‘In the short run, the market is a voting machine but in the long run, it is a weighing machine.’ So this free visualization of the analyst consensus on future earnings could help you make the right decision about whether to buy, sell, or hold.
Of course you might be able to find a better stock than Fisher & Paykel Healthcare. So you may wish to see this free collection of other companies that have grown earnings strongly.
We aim to bring you long-term focused research analysis driven by fundamental data. Note that our analysis may not factor in the latest price-sensitive company announcements or qualitative material.
If you spot an error that warrants correction, please contact the editor at editorial-team@simplywallst.com. This article by Simply Wall St is general in nature. It does not constitute a recommendation to buy or sell any stock, and does not take account of your objectives, or your financial situation. Simply Wall St has no position in the stocks mentioned. Thank you for reading.
