
 Yahoo Finance
 Should You Be Tempted To Sell Jindal Stainless Limited (NSE:JSL) Because Of Its P/E Ratio?

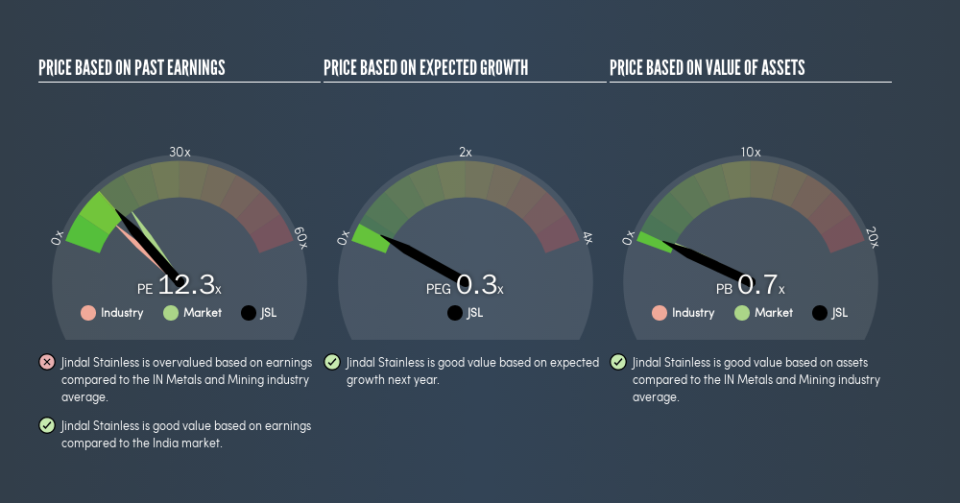
Today, we'll introduce the concept of the P/E ratio for those who are learning about investing. We'll look at Jindal Stainless Limited's (NSE:JSL) P/E ratio and reflect on what it tells us about the company's share price. Looking at earnings over the last twelve months, Jindal Stainless has a P/E ratio of 12.29. That means that at current prices, buyers pay ₹12.29 for every ₹1 in trailing yearly profits.
Want to participate in a short research study? Help shape the future of investing tools and you could win a $250 gift card!
See our latest analysis for Jindal Stainless
How Do I Calculate Jindal Stainless's Price To Earnings Ratio?
The formula for P/E is:
Price to Earnings Ratio = Share Price ÷ Earnings per Share (EPS)
Or for Jindal Stainless:
P/E of 12.29 = ₹36.5 ÷ ₹2.97 (Based on the trailing twelve months to March 2019.)
Is A High P/E Ratio Good?
A higher P/E ratio implies that investors pay a higher price for the earning power of the business. That isn't a good or a bad thing on its own, but a high P/E means that buyers have a higher opinion of the business's prospects, relative to stocks with a lower P/E.
How Growth Rates Impact P/E Ratios
Probably the most important factor in determining what P/E a company trades on is the earnings growth. That's because companies that grow earnings per share quickly will rapidly increase the 'E' in the equation. And in that case, the P/E ratio itself will drop rather quickly. So while a stock may look expensive based on past earnings, it could be cheap based on future earnings.
Jindal Stainless's earnings per share fell by 61% in the last twelve months.
How Does Jindal Stainless's P/E Ratio Compare To Its Peers?
The P/E ratio essentially measures market expectations of a company. The image below shows that Jindal Stainless has a higher P/E than the average (10) P/E for companies in the metals and mining industry.
Its relatively high P/E ratio indicates that Jindal Stainless shareholders think it will perform better than other companies in its industry classification. Shareholders are clearly optimistic, but the future is always uncertain. So investors should always consider the P/E ratio alongside other factors, such as whether company directors have been buying shares.
Remember: P/E Ratios Don't Consider The Balance Sheet
The 'Price' in P/E reflects the market capitalization of the company. So it won't reflect the advantage of cash, or disadvantage of debt. Hypothetically, a company could reduce its future P/E ratio by spending its cash (or taking on debt) to achieve higher earnings.
Spending on growth might be good or bad a few years later, but the point is that the P/E ratio does not account for the option (or lack thereof).
Is Debt Impacting Jindal Stainless's P/E?
Net debt totals a substantial 205% of Jindal Stainless's market cap. If you want to compare its P/E ratio to other companies, you must keep in mind that these debt levels would usually warrant a relatively low P/E.
The Verdict On Jindal Stainless's P/E Ratio
Jindal Stainless's P/E is 12.3 which is below average (15.4) in the IN market. When you consider that the company has significant debt, and didn't grow EPS last year, it isn't surprising that the market has muted expectations.
When the market is wrong about a stock, it gives savvy investors an opportunity. If the reality for a company is not as bad as the P/E ratio indicates, then the share price should increase as the market realizes this. So this free visual report on analyst forecasts could hold the key to an excellent investment decision.
Of course you might be able to find a better stock than Jindal Stainless. So you may wish to see this free collection of other companies that have grown earnings strongly.
We aim to bring you long-term focused research analysis driven by fundamental data. Note that our analysis may not factor in the latest price-sensitive company announcements or qualitative material.
If you spot an error that warrants correction, please contact the editor at editorial-team@simplywallst.com. This article by Simply Wall St is general in nature. It does not constitute a recommendation to buy or sell any stock, and does not take account of your objectives, or your financial situation. Simply Wall St has no position in the stocks mentioned. Thank you for reading.
