
 Yahoo Finance
 Should You Be Tempted To Sell Koninklijke Philips NV (AMS:PHIA) Because Of Its P/E Ratio?

The goal of this article is to teach you how to use price to earnings ratios (P/E ratios). To keep it practical, we’ll show how Koninklijke Philips NV’s (AMS:PHIA) P/E ratio could help you assess the value on offer. Koninklijke Philips has a P/E ratio of 30.25, based on the last twelve months. That is equivalent to an earnings yield of about 3.3%.
Check out our latest analysis for Koninklijke Philips
How Do You Calculate Koninklijke Philips’s P/E Ratio?
The formula for price to earnings is:
Price to Earnings Ratio = Share Price ÷ Earnings per Share (EPS)
Or for Koninklijke Philips:
P/E of 30.25 = €33.4 ÷ €1.1 (Based on the trailing twelve months to September 2018.)
Is A High Price-to-Earnings Ratio Good?
A higher P/E ratio means that buyers have to pay a higher price for each €1 the company has earned over the last year. All else being equal, it’s better to pay a low price — but as Warren Buffett said, ‘It’s far better to buy a wonderful company at a fair price than a fair company at a wonderful price.’
How Growth Rates Impact P/E Ratios
Probably the most important factor in determining what P/E a company trades on is the earnings growth. When earnings grow, the ‘E’ increases, over time. That means even if the current P/E is high, it will reduce over time if the share price stays flat. Then, a lower P/E should attract more buyers, pushing the share price up.
Most would be impressed by Koninklijke Philips earnings growth of 23% in the last year. And its annual EPS growth rate over 5 years is 12%. So one might expect an above average P/E ratio.
How Does Koninklijke Philips’s P/E Ratio Compare To Its Peers?
The P/E ratio essentially measures market expectations of a company. The image below shows that Koninklijke Philips has a higher P/E than the average (28) P/E for companies in the medical equipment industry.
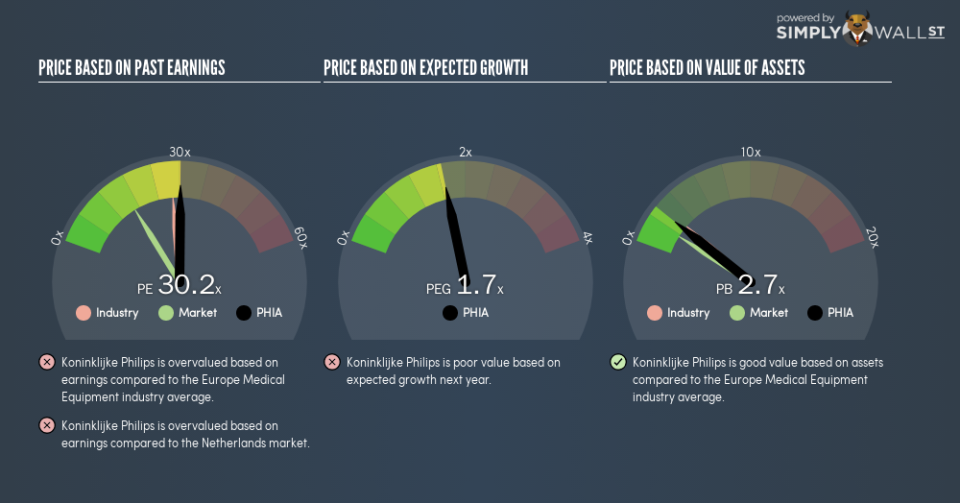
Koninklijke Philips’s P/E tells us that market participants think the company will perform better than its industry peers, going forward. Shareholders are clearly optimistic, but the future is always uncertain. So investors should delve deeper. I like to check if company insiders have been buying or selling.
Remember: P/E Ratios Don’t Consider The Balance Sheet
The ‘Price’ in P/E reflects the market capitalization of the company. Thus, the metric does not reflect cash or debt held by the company. Hypothetically, a company could reduce its future P/E ratio by spending its cash (or taking on debt) to achieve higher earnings.
Such expenditure might be good or bad, in the long term, but the point here is that the balance sheet is not reflected by this ratio.
Is Debt Impacting Koninklijke Philips’s P/E?
Net debt totals 11% of Koninklijke Philips’s market cap. That’s enough debt to impact the P/E ratio a little; so keep it in mind if you’re comparing it to companies without debt.
The Bottom Line On Koninklijke Philips’s P/E Ratio
Koninklijke Philips trades on a P/E ratio of 30.2, which is above the NL market average of 16.5. The company is not overly constrained by its modest debt levels, and it is growing earnings per share. Therefore it seems reasonable that the market would have relatively high expectations of the company
Investors have an opportunity when market expectations about a stock are wrong. As value investor Benjamin Graham famously said, ‘In the short run, the market is a voting machine but in the long run, it is a weighing machine.’ So this free visualization of the analyst consensus on future earnings could help you make the right decision about whether to buy, sell, or hold.
You might be able to find a better buy than Koninklijke Philips. If you want a selection of possible winners, check out this free list of interesting companies that trade on a P/E below 20 (but have proven they can grow earnings).
To help readers see past the short term volatility of the financial market, we aim to bring you a long-term focused research analysis purely driven by fundamental data. Note that our analysis does not factor in the latest price-sensitive company announcements.
The author is an independent contributor and at the time of publication had no position in the stocks mentioned. For errors that warrant correction please contact the editor at editorial-team@simplywallst.com.
