
 Yahoo Finance
 We Think Pinduoduo (NASDAQ:PDD) Might Have The DNA Of A Multi-Bagger
What are the early trends we should look for to identify a stock that could multiply in value over the long term? One common approach is to try and find a company with returns on capital employed (ROCE) that are increasing, in conjunction with a growing amount of capital employed. Put simply, these types of businesses are compounding machines, meaning they are continually reinvesting their earnings at ever-higher rates of return. With that in mind, the ROCE of Pinduoduo (NASDAQ:PDD) looks great, so lets see what the trend can tell us.
What Is Return On Capital Employed (ROCE)?
For those who don't know, ROCE is a measure of a company's yearly pre-tax profit (its return), relative to the capital employed in the business. Analysts use this formula to calculate it for Pinduoduo:
Return on Capital Employed = Earnings Before Interest and Tax (EBIT) ÷ (Total Assets - Current Liabilities)
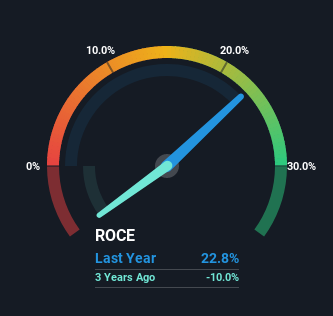
0.23 = CN¥28b ÷ (CN¥209b - CN¥85b) (Based on the trailing twelve months to September 2022).
Thus, Pinduoduo has an ROCE of 23%. That's a fantastic return and not only that, it outpaces the average of 14% earned by companies in a similar industry.
Check out our latest analysis for Pinduoduo
In the above chart we have measured Pinduoduo's prior ROCE against its prior performance, but the future is arguably more important. If you'd like, you can check out the forecasts from the analysts covering Pinduoduo here for free.
What The Trend Of ROCE Can Tell Us
We're delighted to see that Pinduoduo is reaping rewards from its investments and is now generating some pre-tax profits. About five years ago the company was generating losses but things have turned around because it's now earning 23% on its capital. In addition to that, Pinduoduo is employing 12,350% more capital than previously which is expected of a company that's trying to break into profitability. This can tell us that the company has plenty of reinvestment opportunities that are able to generate higher returns.
On a related note, the company's ratio of current liabilities to total assets has decreased to 41%, which basically reduces it's funding from the likes of short-term creditors or suppliers. This tells us that Pinduoduo has grown its returns without a reliance on increasing their current liabilities, which we're very happy with. However, current liabilities are still at a pretty high level, so just be aware that this can bring with it some risks.
What We Can Learn From Pinduoduo's ROCE
Overall, Pinduoduo gets a big tick from us thanks in most part to the fact that it is now profitable and is reinvesting in its business. And a remarkable 130% total return over the last three years tells us that investors are expecting more good things to come in the future. Therefore, we think it would be worth your time to check if these trends are going to continue.
Pinduoduo does have some risks though, and we've spotted 1 warning sign for Pinduoduo that you might be interested in.
If you'd like to see other companies earning high returns, check out our free list of companies earning high returns with solid balance sheets here.
Have feedback on this article? Concerned about the content? Get in touch with us directly. Alternatively, email editorial-team (at) simplywallst.com.
This article by Simply Wall St is general in nature. We provide commentary based on historical data and analyst forecasts only using an unbiased methodology and our articles are not intended to be financial advice. It does not constitute a recommendation to buy or sell any stock, and does not take account of your objectives, or your financial situation. We aim to bring you long-term focused analysis driven by fundamental data. Note that our analysis may not factor in the latest price-sensitive company announcements or qualitative material. Simply Wall St has no position in any stocks mentioned.
Join A Paid User Research Session
You’ll receive a US$30 Amazon Gift card for 1 hour of your time while helping us build better investing tools for the individual investors like yourself. Sign up here
