
 Yahoo Finance
 Those who invested in MA Financial Group (ASX:MAF) a year ago are up 110%
Unless you borrow money to invest, the potential losses are limited. But if you pick the right business to buy shares in, you can make more than you can lose. For example, the MA Financial Group Limited (ASX:MAF) share price has soared 104% in the last 1 year. Most would be very happy with that, especially in just one year! Also pleasing for shareholders was the 50% gain in the last three months. It is also impressive that the stock is up 60% over three years, adding to the sense that it is a real winner.
So let's assess the underlying fundamentals over the last 1 year and see if they've moved in lock-step with shareholder returns.
View our latest analysis for MA Financial Group
To paraphrase Benjamin Graham: Over the short term the market is a voting machine, but over the long term it's a weighing machine. One way to examine how market sentiment has changed over time is to look at the interaction between a company's share price and its earnings per share (EPS).
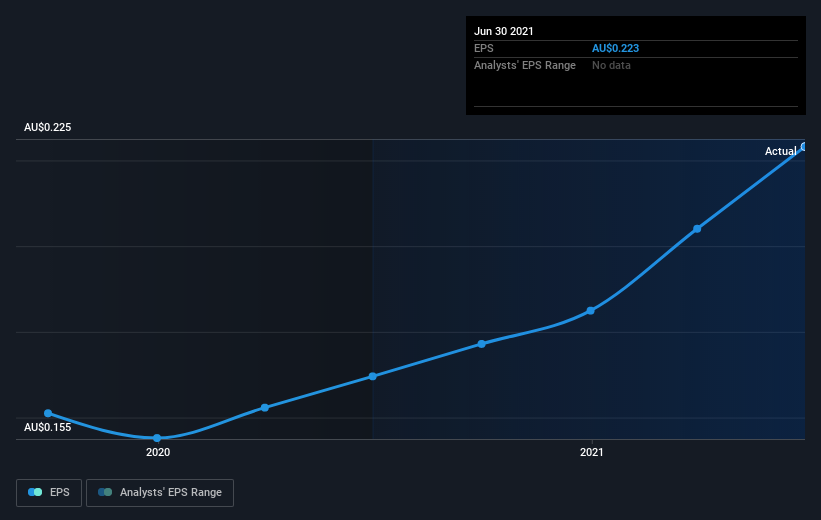
MA Financial Group was able to grow EPS by 32% in the last twelve months. The share price gain of 104% certainly outpaced the EPS growth. So it's fair to assume the market has a higher opinion of the business than it a year ago.
You can see below how EPS has changed over time (discover the exact values by clicking on the image).
We like that insiders have been buying shares in the last twelve months. Even so, future earnings will be far more important to whether current shareholders make money. Dive deeper into the earnings by checking this interactive graph of MA Financial Group's earnings, revenue and cash flow.
What About Dividends?
When looking at investment returns, it is important to consider the difference between total shareholder return (TSR) and share price return. The TSR incorporates the value of any spin-offs or discounted capital raisings, along with any dividends, based on the assumption that the dividends are reinvested. So for companies that pay a generous dividend, the TSR is often a lot higher than the share price return. In the case of MA Financial Group, it has a TSR of 110% for the last 1 year. That exceeds its share price return that we previously mentioned. This is largely a result of its dividend payments!
A Different Perspective
It's nice to see that MA Financial Group shareholders have gained 110% (in total) over the last year. That includes the value of the dividend. So this year's TSR was actually better than the three-year TSR (annualized) of 19%. Given the track record of solid returns over varying time frames, it might be worth putting MA Financial Group on your watchlist. I find it very interesting to look at share price over the long term as a proxy for business performance. But to truly gain insight, we need to consider other information, too. Take risks, for example - MA Financial Group has 2 warning signs (and 1 which is a bit unpleasant) we think you should know about.
MA Financial Group is not the only stock that insiders are buying. For those who like to find winning investments this free list of growing companies with recent insider purchasing, could be just the ticket.
Please note, the market returns quoted in this article reflect the market weighted average returns of stocks that currently trade on AU exchanges.
This article by Simply Wall St is general in nature. We provide commentary based on historical data and analyst forecasts only using an unbiased methodology and our articles are not intended to be financial advice. It does not constitute a recommendation to buy or sell any stock, and does not take account of your objectives, or your financial situation. We aim to bring you long-term focused analysis driven by fundamental data. Note that our analysis may not factor in the latest price-sensitive company announcements or qualitative material. Simply Wall St has no position in any stocks mentioned.
Have feedback on this article? Concerned about the content? Get in touch with us directly. Alternatively, email editorial-team (at) simplywallst.com.
