
 Yahoo Finance
 Those who invested in TC Bancshares (NASDAQ:TCBC) a year ago are up 21%
If you want to compound wealth in the stock market, you can do so by buying an index fund. But you can significantly boost your returns by picking above-average stocks. For example, the TC Bancshares, Inc. (NASDAQ:TCBC) share price is up 20% in the last 1 year, clearly besting the market decline of around 9.1% (not including dividends). So that should have shareholders smiling. TC Bancshares hasn't been listed for long, so it's still not clear if it is a long term winner.
Now it's worth having a look at the company's fundamentals too, because that will help us determine if the long term shareholder return has matched the performance of the underlying business.
View our latest analysis for TC Bancshares
While the efficient markets hypothesis continues to be taught by some, it has been proven that markets are over-reactive dynamic systems, and investors are not always rational. One way to examine how market sentiment has changed over time is to look at the interaction between a company's share price and its earnings per share (EPS).
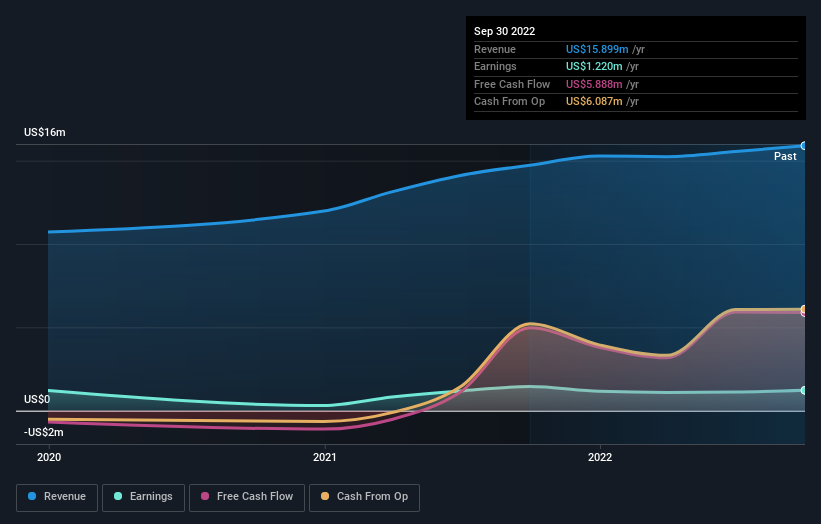
Over the last twelve months, TC Bancshares actually shrank its EPS by 26%.
So we don't think that investors are paying too much attention to EPS. Indeed, when EPS is declining but the share price is up, it often means the market is considering other factors.
We are skeptical of the suggestion that the 0.6% dividend yield would entice buyers to the stock. We think that the revenue growth of 8.0% could have some investors interested. Many businesses do go through a phase where they have to forgo some profits to drive business development, and sometimes its for the best.
The image below shows how earnings and revenue have tracked over time (if you click on the image you can see greater detail).
It's probably worth noting that the CEO is paid less than the median at similar sized companies. But while CEO remuneration is always worth checking, the really important question is whether the company can grow earnings going forward. Dive deeper into the earnings by checking this interactive graph of TC Bancshares' earnings, revenue and cash flow.
A Different Perspective
TC Bancshares shareholders should be happy with the total gain of 21% over the last twelve months, including dividends. And the share price momentum remains respectable, with a gain of 10% in the last three months. This suggests the company is continuing to win over new investors. It's always interesting to track share price performance over the longer term. But to understand TC Bancshares better, we need to consider many other factors. Take risks, for example - TC Bancshares has 1 warning sign we think you should be aware of.
If you would prefer to check out another company -- one with potentially superior financials -- then do not miss this free list of companies that have proven they can grow earnings.
Please note, the market returns quoted in this article reflect the market weighted average returns of stocks that currently trade on US exchanges.
Have feedback on this article? Concerned about the content? Get in touch with us directly. Alternatively, email editorial-team (at) simplywallst.com.
This article by Simply Wall St is general in nature. We provide commentary based on historical data and analyst forecasts only using an unbiased methodology and our articles are not intended to be financial advice. It does not constitute a recommendation to buy or sell any stock, and does not take account of your objectives, or your financial situation. We aim to bring you long-term focused analysis driven by fundamental data. Note that our analysis may not factor in the latest price-sensitive company announcements or qualitative material. Simply Wall St has no position in any stocks mentioned.
Join A Paid User Research Session
You’ll receive a US$30 Amazon Gift card for 1 hour of your time while helping us build better investing tools for the individual investors like yourself. Sign up here
