
 Yahoo Finance
 Is Tiffany & Co.’s (NYSE:TIF) Liquidity Good Enough?

Small-caps and large-caps are wildly popular among investors; however, mid-cap stocks, such as Tiffany & Co. (NYSE:TIF) with a market-capitalization of US$9.6b, rarely draw their attention. Surprisingly though, when accounted for risk, mid-caps have delivered better returns compared to the two other categories of stocks. TIF’s financial liquidity and debt position will be analysed in this article, to get an idea of whether the company can fund opportunities for strategic growth and maintain strength through economic downturns. Remember this is a very top-level look that focuses exclusively on financial health, so I recommend a deeper analysis into TIF here.
View our latest analysis for Tiffany
Does TIF produce enough cash relative to debt?
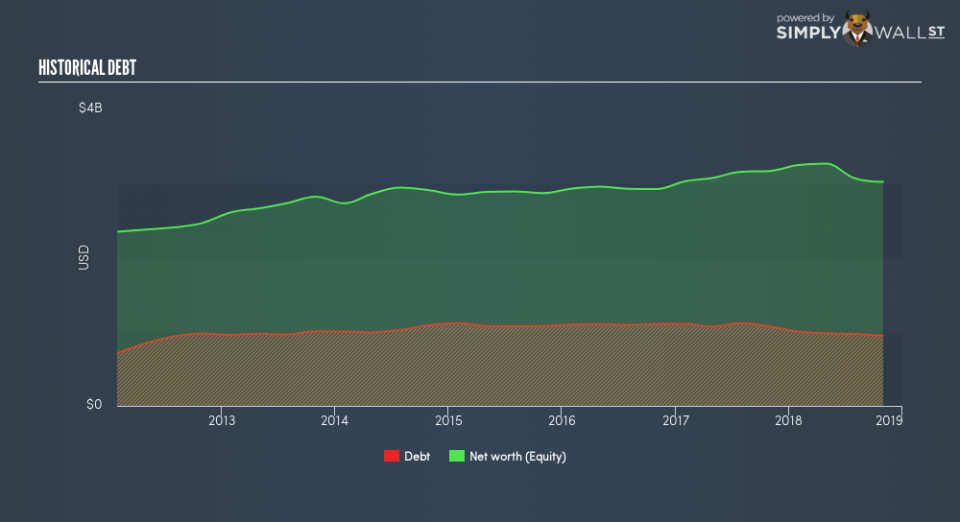
TIF has shrunken its total debt levels in the last twelve months, from US$1.1b to US$949m , which also accounts for long term debt. With this debt payback, the current cash and short-term investment levels stands at US$655m for investing into the business. On top of this, TIF has produced US$658m in operating cash flow in the last twelve months, leading to an operating cash to total debt ratio of 69%, signalling that TIF’s current level of operating cash is high enough to cover debt. This ratio can also be a sign of operational efficiency as an alternative to return on assets. In TIF’s case, it is able to generate 0.69x cash from its debt capital.
Can TIF pay its short-term liabilities?
Looking at TIF’s US$616m in current liabilities, it appears that the company has been able to meet these obligations given the level of current assets of US$3.6b, with a current ratio of 5.86x. However, a ratio above 3x may be considered excessive by some investors, yet this is not usually a major negative for a company.
Is TIF’s debt level acceptable?
With debt at 31% of equity, TIF may be thought of as appropriately levered. This range is considered safe as TIF is not taking on too much debt obligation, which can be restrictive and risky for equity-holders. We can test if TIF’s debt levels are sustainable by measuring interest payments against earnings of a company. Ideally, earnings before interest and tax (EBIT) should cover net interest by at least three times. For TIF, the ratio of 20.56x suggests that interest is comfortably covered, which means that lenders may be less hesitant to lend out more funding as TIF’s high interest coverage is seen as responsible and safe practice.
Next Steps:
TIF’s debt level is appropriate for a company its size, and it is also able to generate sufficient cash flow coverage, meaning it has been able to put its debt in good use. In addition to this, the company exhibits an ability to meet its near term obligations should an adverse event occur. I admit this is a fairly basic analysis for TIF’s financial health. Other important fundamentals need to be considered alongside. You should continue to research Tiffany to get a better picture of the stock by looking at:
Future Outlook: What are well-informed industry analysts predicting for TIF’s future growth? Take a look at our free research report of analyst consensus for TIF’s outlook.
Valuation: What is TIF worth today? Is the stock undervalued, even when its growth outlook is factored into its intrinsic value? The intrinsic value infographic in our free research report helps visualize whether TIF is currently mispriced by the market.
Other High-Performing Stocks: Are there other stocks that provide better prospects with proven track records? Explore our free list of these great stocks here.
To help readers see past the short term volatility of the financial market, we aim to bring you a long-term focused research analysis purely driven by fundamental data. Note that our analysis does not factor in the latest price-sensitive company announcements.
The author is an independent contributor and at the time of publication had no position in the stocks mentioned. For errors that warrant correction please contact the editor at editorial-team@simplywallst.com.
