
 Yahoo Finance
 Top Ranked Value Stocks to Buy for May 24th
Here are four stocks with buy rank and strong value characteristics for investors to consider today, May 24th:
Ryerson Holding Corporation (RYI): This processor and distributor of industrial metals has a Zacks Rank #1 (Strong Buy), and seen the Zacks Consensus Estimate for its current year earnings rising 54.7% over the last 60 days.
Ryerson Holding Corporation Price and Consensus
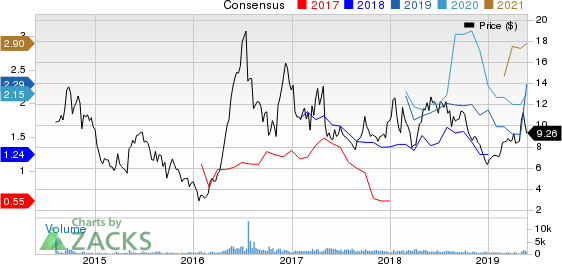
Ryerson Holding Corporation price-consensus-chart | Ryerson Holding Corporation Quote
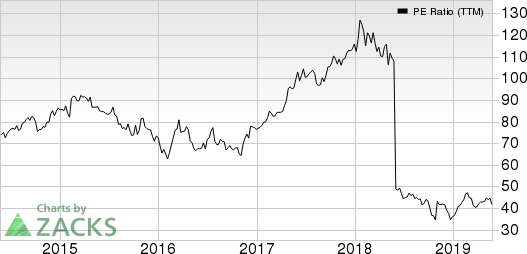
Ryerson Holding has a price-to-earnings ratio (P/E) of 4.05, compared with 11.20 for the industry. The company possesses a Value Score of B.
Ryerson Holding Corporation PE Ratio (TTM)

Ryerson Holding Corporation pe-ratio-ttm | Ryerson Holding Corporation Quote
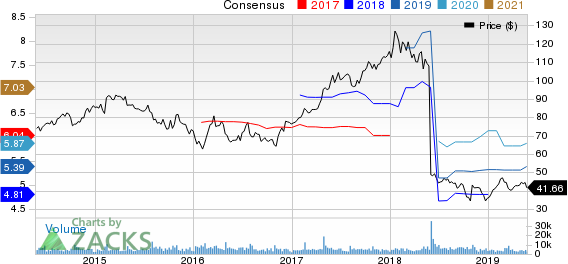
Reliance Steel & Aluminum Co. (RS): This metals service center company has a Zacks Rank #2 (Buy), and seen the Zacks Consensus Estimate for its current year earnings rising 6% over the last 60 days.
Reliance Steel & Aluminum Co. Price and Consensus

Reliance Steel & Aluminum Co. price-consensus-chart | Reliance Steel & Aluminum Co. Quote
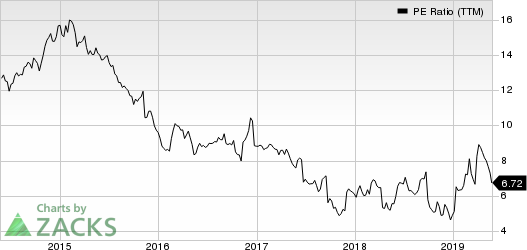
Reliance Steel has a price-to-earnings ratio (P/E) of 9.20, compared with 18.00 for the industry. The company possesses a Value Score of A.
Reliance Steel & Aluminum Co. PE Ratio (TTM)

Reliance Steel & Aluminum Co. pe-ratio-ttm | Reliance Steel & Aluminum Co. Quote
Wyndham Destinations, Inc. (WYND): This vacation ownership and exchange company has a Zacks Rank #2 (Buy), and seen the Zacks Consensus Estimate for its current year earnings rising 1.3% over the last 60 days.
WYNDHAM DESTINATIONS, INC. Price and Consensus
WYNDHAM DESTINATIONS, INC. price-consensus-chart | WYNDHAM DESTINATIONS, INC. Quote
Wyndham has a price-to-earnings ratio (P/E) of 7.73 compared with 68.20 for the industry. The company possesses a Value Score of A.
WYNDHAM DESTINATIONS, INC. PE Ratio (TTM)
WYNDHAM DESTINATIONS, INC. pe-ratio-ttm | WYNDHAM DESTINATIONS, INC. Quote
Bed Bath & Beyond Inc. (BBBY): This chain of retail stores has a Zacks Rank #2 (Buy), and seen the Zacks Consensus Estimate for its current year earnings rising 11.9% over the last 60 days.
Bed Bath & Beyond Inc. Price and Consensus

Bed Bath & Beyond Inc. price-consensus-chart | Bed Bath & Beyond Inc. Quote
Bed Bath & Beyond has a price-to-earnings ratio (P/E) of 7.01 compared with 13.40 for the industry. The company possesses a Value Score of A.
Bed Bath & Beyond Inc. PE Ratio (TTM)
Bed Bath & Beyond Inc. pe-ratio-ttm | Bed Bath & Beyond Inc. Quote
See the full list of top ranked stocks here
Learn more about the Value score and how it is calculated here.
Looking for Stocks with Skyrocketing Upside?
Zacks has just released a Special Report on the booming investment opportunities of legal marijuana.
Ignited by new referendums and legislation, this industry is expected to blast from an already robust $6.7 billion to $20.2 billion in 2021. Early investors stand to make a killing, but you have to be ready to act and know just where to look.
See the pot trades we're targeting>>
Want the latest recommendations from Zacks Investment Research? Today, you can download 7 Best Stocks for the Next 30 Days. Click to get this free report
WYNDHAM DESTINATIONS, INC. (WYND) : Free Stock Analysis Report
Ryerson Holding Corporation (RYI) : Free Stock Analysis Report
Reliance Steel & Aluminum Co. (RS) : Free Stock Analysis Report
Bed Bath & Beyond Inc. (BBBY) : Free Stock Analysis Report
To read this article on Zacks.com click here.
Zacks Investment Research
