
 Yahoo Finance
 TransDigm Group (NYSE:TDG) jumps 3.3% this week, though earnings growth is still tracking behind three-year shareholder returns
It might seem bad, but the worst that can happen when you buy a stock (without leverage) is that its share price goes to zero. But in contrast you can make much more than 100% if the company does well. For instance the TransDigm Group Incorporated (NYSE:TDG) share price is 155% higher than it was three years ago. How nice for those who held the stock! It's also good to see the share price up 18% over the last quarter. But this move may well have been assisted by the reasonably buoyant market (up 7.4% in 90 days).
On the back of a solid 7-day performance, let's check what role the company's fundamentals have played in driving long term shareholder returns.
Check out our latest analysis for TransDigm Group
There is no denying that markets are sometimes efficient, but prices do not always reflect underlying business performance. By comparing earnings per share (EPS) and share price changes over time, we can get a feel for how investor attitudes to a company have morphed over time.
TransDigm Group was able to grow its EPS at 14% per year over three years, sending the share price higher. In comparison, the 37% per year gain in the share price outpaces the EPS growth. So it's fair to assume the market has a higher opinion of the business than it did three years ago. It is quite common to see investors become enamoured with a business, after a few years of solid progress. This favorable sentiment is reflected in its (fairly optimistic) P/E ratio of 47.18.
The image below shows how EPS has tracked over time (if you click on the image you can see greater detail).
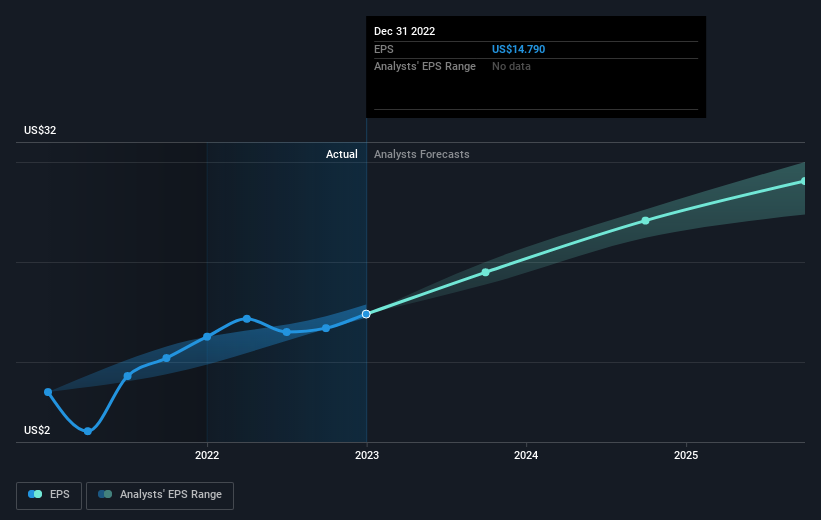
We know that TransDigm Group has improved its bottom line lately, but is it going to grow revenue? If you're interested, you could check this free report showing consensus revenue forecasts.
A Dividend Lost
It's important to keep in mind that we've been talking about the share price returns, which don't include dividends, while the total shareholder return does. Many would argue the TSR gives a more complete picture of the value a stock brings to its holders. Over the last 3 years, TransDigm Group generated a TSR of 162%, which is, of course, better than the share price return. Although the company had to cut dividends, it has paid cash to shareholders in the past.
A Different Perspective
It's nice to see that TransDigm Group shareholders have received a total shareholder return of 13% over the last year. Having said that, the five-year TSR of 23% a year, is even better. The pessimistic view would be that be that the stock has its best days behind it, but on the other hand the price might simply be moderating while the business itself continues to execute. It's always interesting to track share price performance over the longer term. But to understand TransDigm Group better, we need to consider many other factors. For example, we've discovered 3 warning signs for TransDigm Group (2 don't sit too well with us!) that you should be aware of before investing here.
But note: TransDigm Group may not be the best stock to buy. So take a peek at this free list of interesting companies with past earnings growth (and further growth forecast).
Please note, the market returns quoted in this article reflect the market weighted average returns of stocks that currently trade on American exchanges.
Have feedback on this article? Concerned about the content? Get in touch with us directly. Alternatively, email editorial-team (at) simplywallst.com.
This article by Simply Wall St is general in nature. We provide commentary based on historical data and analyst forecasts only using an unbiased methodology and our articles are not intended to be financial advice. It does not constitute a recommendation to buy or sell any stock, and does not take account of your objectives, or your financial situation. We aim to bring you long-term focused analysis driven by fundamental data. Note that our analysis may not factor in the latest price-sensitive company announcements or qualitative material. Simply Wall St has no position in any stocks mentioned.
Join A Paid User Research Session
You’ll receive a US$30 Amazon Gift card for 1 hour of your time while helping us build better investing tools for the individual investors like yourself. Sign up here
