
 Yahoo Finance
 TransDigm Group (NYSE:TDG) shareholders have earned a 25% CAGR over the last five years
The most you can lose on any stock (assuming you don't use leverage) is 100% of your money. But on the bright side, you can make far more than 100% on a really good stock. Long term TransDigm Group Incorporated (NYSE:TDG) shareholders would be well aware of this, since the stock is up 163% in five years. On top of that, the share price is up 21% in about a quarter. The company reported its financial results recently; you can catch up on the latest numbers by reading our company report.
So let's assess the underlying fundamentals over the last 5 years and see if they've moved in lock-step with shareholder returns.
See our latest analysis for TransDigm Group
While markets are a powerful pricing mechanism, share prices reflect investor sentiment, not just underlying business performance. By comparing earnings per share (EPS) and share price changes over time, we can get a feel for how investor attitudes to a company have morphed over time.
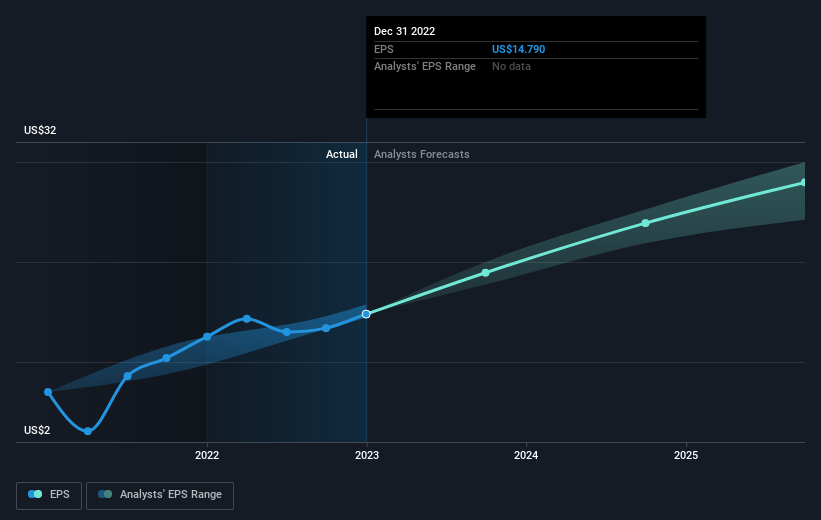
During five years of share price growth, TransDigm Group achieved compound earnings per share (EPS) growth of 4.2% per year. This EPS growth is slower than the share price growth of 21% per year, over the same period. This suggests that market participants hold the company in higher regard, these days. And that's hardly shocking given the track record of growth. This optimism is visible in its fairly high P/E ratio of 48.07.
You can see below how EPS has changed over time (discover the exact values by clicking on the image).
We know that TransDigm Group has improved its bottom line lately, but is it going to grow revenue? Check if analysts think TransDigm Group will grow revenue in the future.
A Dividend Lost
It's important to keep in mind that we've been talking about the share price returns, which don't include dividends, while the total shareholder return does. Many would argue the TSR gives a more complete picture of the value a stock brings to its holders. TransDigm Group's TSR over the last 5 years is 202%; better than its share price return. Although the company had to cut dividends, it has paid cash to shareholders in the past.
A Different Perspective
It's good to see that TransDigm Group has rewarded shareholders with a total shareholder return of 18% in the last twelve months. However, the TSR over five years, coming in at 25% per year, is even more impressive. While it is well worth considering the different impacts that market conditions can have on the share price, there are other factors that are even more important. Take risks, for example - TransDigm Group has 2 warning signs we think you should be aware of.
If you are like me, then you will not want to miss this free list of growing companies that insiders are buying.
Please note, the market returns quoted in this article reflect the market weighted average returns of stocks that currently trade on US exchanges.
Have feedback on this article? Concerned about the content? Get in touch with us directly. Alternatively, email editorial-team (at) simplywallst.com.
This article by Simply Wall St is general in nature. We provide commentary based on historical data and analyst forecasts only using an unbiased methodology and our articles are not intended to be financial advice. It does not constitute a recommendation to buy or sell any stock, and does not take account of your objectives, or your financial situation. We aim to bring you long-term focused analysis driven by fundamental data. Note that our analysis may not factor in the latest price-sensitive company announcements or qualitative material. Simply Wall St has no position in any stocks mentioned.
Join A Paid User Research Session
You’ll receive a US$30 Amazon Gift card for 1 hour of your time while helping us build better investing tools for the individual investors like yourself. Sign up here
