
 Yahoo Finance
 TrueBlue, Inc.'s (NYSE:TBI) Fundamentals Look Pretty Strong: Could The Market Be Wrong About The Stock?
It is hard to get excited after looking at TrueBlue's (NYSE:TBI) recent performance, when its stock has declined 13% over the past three months. However, stock prices are usually driven by a company’s financials over the long term, which in this case look pretty respectable. Specifically, we decided to study TrueBlue's ROE in this article.
Return on Equity or ROE is a test of how effectively a company is growing its value and managing investors’ money. In short, ROE shows the profit each dollar generates with respect to its shareholder investments.
Check out our latest analysis for TrueBlue
How To Calculate Return On Equity?
ROE can be calculated by using the formula:
Return on Equity = Net Profit (from continuing operations) ÷ Shareholders' Equity
So, based on the above formula, the ROE for TrueBlue is:
13% = US$62m ÷ US$496m (Based on the trailing twelve months to December 2022).
The 'return' is the amount earned after tax over the last twelve months. So, this means that for every $1 of its shareholder's investments, the company generates a profit of $0.13.
What Is The Relationship Between ROE And Earnings Growth?
So far, we've learned that ROE is a measure of a company's profitability. We now need to evaluate how much profit the company reinvests or "retains" for future growth which then gives us an idea about the growth potential of the company. Assuming all else is equal, companies that have both a higher return on equity and higher profit retention are usually the ones that have a higher growth rate when compared to companies that don't have the same features.
TrueBlue's Earnings Growth And 13% ROE
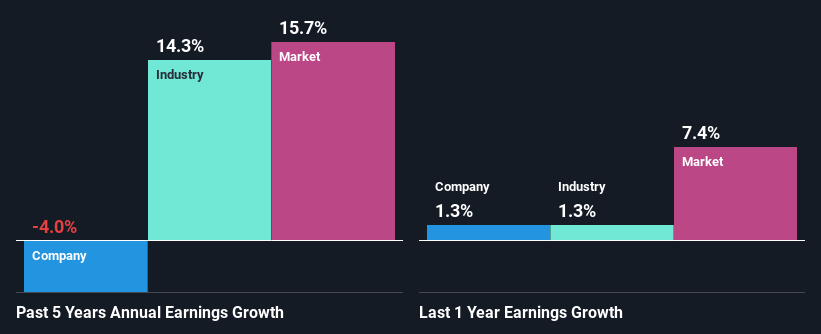
To begin with, TrueBlue seems to have a respectable ROE. Yet, the fact that the company's ROE is lower than the industry average of 16% does temper our expectations. Further research shows that TrueBlue's net income has shrunk at a rate of 4.0% over the last five years. Bear in mind, the company does have a high ROE. It is just that the industry ROE is higher. So there might be other reasons for the earnings to shrink. Such as, the company pays out a huge portion of its earnings as dividends, or is faced with competitive pressures.
So, as a next step, we compared TrueBlue's performance against the industry and were disappointed to discover that while the company has been shrinking its earnings, the industry has been growing its earnings at a rate of 14% in the same period.
The basis for attaching value to a company is, to a great extent, tied to its earnings growth. The investor should try to establish if the expected growth or decline in earnings, whichever the case may be, is priced in. This then helps them determine if the stock is placed for a bright or bleak future. Has the market priced in the future outlook for TBI? You can find out in our latest intrinsic value infographic research report.
Is TrueBlue Making Efficient Use Of Its Profits?
TrueBlue doesn't pay any dividend, meaning that the company is keeping all of its profits, which makes us wonder why it is retaining its earnings if it can't use them to grow its business. So there could be some other explanations in that regard. For instance, the company's business may be deteriorating.
Conclusion
Overall, we feel that TrueBlue certainly does have some positive factors to consider. Yet, the low earnings growth is a bit concerning, especially given that the company has a respectable rate of return and is reinvesting a huge portion of its profits. By the looks of it, there could be some other factors, not necessarily in control of the business, that's preventing growth. In addition, latest analyst forecasts reveal that the company's earnings growth is expected be similar to its current growth rate. To know more about the company's future earnings growth forecasts take a look at this free report on analyst forecasts for the company to find out more.
Have feedback on this article? Concerned about the content? Get in touch with us directly. Alternatively, email editorial-team (at) simplywallst.com.
This article by Simply Wall St is general in nature. We provide commentary based on historical data and analyst forecasts only using an unbiased methodology and our articles are not intended to be financial advice. It does not constitute a recommendation to buy or sell any stock, and does not take account of your objectives, or your financial situation. We aim to bring you long-term focused analysis driven by fundamental data. Note that our analysis may not factor in the latest price-sensitive company announcements or qualitative material. Simply Wall St has no position in any stocks mentioned.
Join A Paid User Research Session
You’ll receive a US$30 Amazon Gift card for 1 hour of your time while helping us build better investing tools for the individual investors like yourself. Sign up here
