
 Yahoo Finance
 TrueBlue (NYSE:TBI) shareholders have endured a 38% loss from investing in the stock five years ago
For many, the main point of investing is to generate higher returns than the overall market. But the main game is to find enough winners to more than offset the losers So we wouldn't blame long term TrueBlue, Inc. (NYSE:TBI) shareholders for doubting their decision to hold, with the stock down 38% over a half decade. And we doubt long term believers are the only worried holders, since the stock price has declined 28% over the last twelve months. Shareholders have had an even rougher run lately, with the share price down 16% in the last 90 days.
Since shareholders are down over the longer term, lets look at the underlying fundamentals over the that time and see if they've been consistent with returns.
See our latest analysis for TrueBlue
In his essay The Superinvestors of Graham-and-Doddsville Warren Buffett described how share prices do not always rationally reflect the value of a business. By comparing earnings per share (EPS) and share price changes over time, we can get a feel for how investor attitudes to a company have morphed over time.
TrueBlue became profitable within the last five years. Most would consider that to be a good thing, so it's counter-intuitive to see the share price declining. Other metrics might give us a better handle on how its value is changing over time.
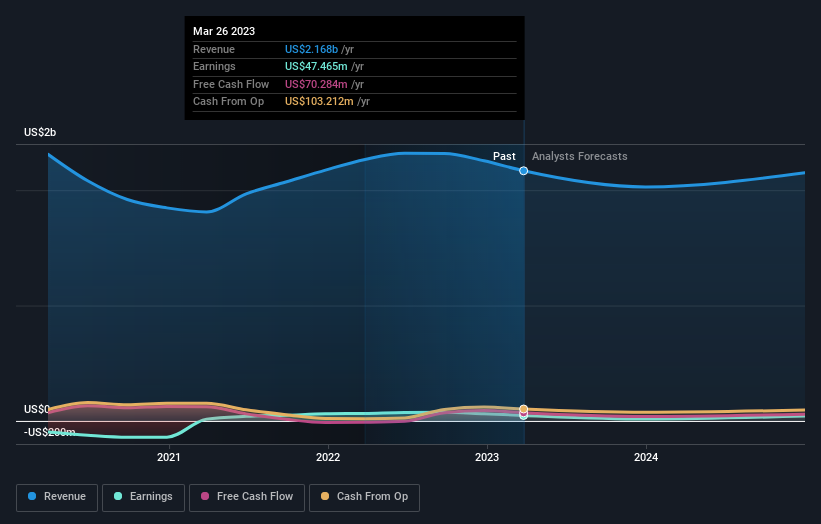
Arguably, the revenue drop of 3.5% a year for half a decade suggests that the company can't grow in the long term. This has probably encouraged some shareholders to sell down the stock.
The company's revenue and earnings (over time) are depicted in the image below (click to see the exact numbers).
We know that TrueBlue has improved its bottom line over the last three years, but what does the future have in store? It might be well worthwhile taking a look at our free report on how its financial position has changed over time.
A Different Perspective
While the broader market gained around 6.9% in the last year, TrueBlue shareholders lost 28%. Even the share prices of good stocks drop sometimes, but we want to see improvements in the fundamental metrics of a business, before getting too interested. Regrettably, last year's performance caps off a bad run, with the shareholders facing a total loss of 7% per year over five years. We realise that Baron Rothschild has said investors should "buy when there is blood on the streets", but we caution that investors should first be sure they are buying a high quality business. Most investors take the time to check the data on insider transactions. You can click here to see if insiders have been buying or selling.
If you would prefer to check out another company -- one with potentially superior financials -- then do not miss this free list of companies that have proven they can grow earnings.
Please note, the market returns quoted in this article reflect the market weighted average returns of stocks that currently trade on American exchanges.
Have feedback on this article? Concerned about the content? Get in touch with us directly. Alternatively, email editorial-team (at) simplywallst.com.
This article by Simply Wall St is general in nature. We provide commentary based on historical data and analyst forecasts only using an unbiased methodology and our articles are not intended to be financial advice. It does not constitute a recommendation to buy or sell any stock, and does not take account of your objectives, or your financial situation. We aim to bring you long-term focused analysis driven by fundamental data. Note that our analysis may not factor in the latest price-sensitive company announcements or qualitative material. Simply Wall St has no position in any stocks mentioned.
Join A Paid User Research Session
You’ll receive a US$30 Amazon Gift card for 1 hour of your time while helping us build better investing tools for the individual investors like yourself. Sign up here
