
 Yahoo Finance
 Truist Financial (TFC) Q1 Earnings Lag on Higher Provisions
Truist Financial’s TFC first-quarter 2023 adjusted earnings of $1.09 per share lagged the Zacks Consensus Estimate of $1.13. Our estimate for earnings was $1.03.
Shares of TFC have tanked almost 4.7% in the pre-market trading on lower-than-expected quarterly results. The fall in deposit balance also weighed on investor sentiments.
Results were adversely impacted by higher provisions and an increase in expenses. Further, the company witnessed a decline in deposits during the quarter. On the other hand, an increase in net income interest (NII) and non-interest income offered support. Also, higher interest rates drove margins.
Net income available to common shareholders was $1.41 billion, up from $1.33 billion in the prior-year quarter. Our estimate for the same was $1.38 billion.
Revenues Improve, Expenses Rise
Total quarterly revenues were $6.10 billion, up 14.6% year over year. The top line marginally beat the Zacks Consensus Estimate of $6.09 billion. Our estimate for revenues was $6.01 billion.
Tax-equivalent NII increased 22.1% year over year to $3.92 billion. The rise was driven by strong loan growth and higher market interest rates, coupled with well-controlled deposit costs, partially offset by lower purchase accounting accretion and PPP revenues. Our estimate for NII (FTE) was $3.82 billion.
Net interest margin expanded 41 basis points (bps) to 3.17%. Our estimate for the same was 3.16%.
Non-interest income grew 4.3% to $2.23 billion. This was mainly attributable to a rise in lending-related fees, mortgage banking income, insurance income and operating lease income. Our estimate for non-interest income was the same as the reported number.
Non-interest expenses were $3.69 billion, up marginally year over year. Our estimate for the same was $3.75 billion.
The adjusted efficiency ratio was 56.8%, down from 58.3% in the prior-year quarter. A fall in the efficiency ratio indicates an improvement in profitability.
As of Mar 31, 2023, total average deposits were $408.5 billion, down 1.2% sequentially. The fall was largely due to the impacts of monetary tightening and higher-rate alternatives. Average total loans and leases of $326 billion grew 1.7%.
Credit Quality Worsens
As of Mar 31, 2023, total non-performing assets (NPAs) were $1.26 billion, up 11.1% year over year. Our estimate for the metric was $1.36 billion.
Provision for credit losses was $502 million against a benefit of $95 in the prior-year quarter. Our estimate for provisions was $416.9 million. Net charge-offs were 0.37% of average loans and leases, up 12 bps from the year-ago quarter.
However, the allowance for loan and lease losses was 1.37% of total loans and leases held for investment, which decreased 7 bps.
Profitability Ratios Improve, Capital Ratios Weaken
At the end of the reported quarter, the return on average assets was 1.10%, up from 1.07% in the prior-year quarter. Return on average common equity was 10.3%, up from 9% in the first quarter of 2022.
As of Mar 31, 2023, the Tier 1 risk-based capital ratio was 10.6% compared with 11% recorded in the prior-year quarter. The common equity Tier 1 ratio was 9.1% as of Mar 31, 2023, down from 9.4% as of Mar 31, 2022.
Share Repurchases
In the reported quarter, Truist Financial did not repurchase any shares.
Our Take
Truist Financial’s efforts to capitalize on the insurance business bode well. Apart from strategic buyouts, the company sold a 20% stake in Truist Insurance Holdings in April, unlocking the value of the unit as well as investors.
Further, a decent rise in loan demand, higher rates and efforts to bolster fee income are expected to continue to support the company’s top line. However, elevated expenses and ambiguity over geopolitical and economic risks are major headwinds.
Truist Financial Corporation Price, Consensus and EPS Surprise
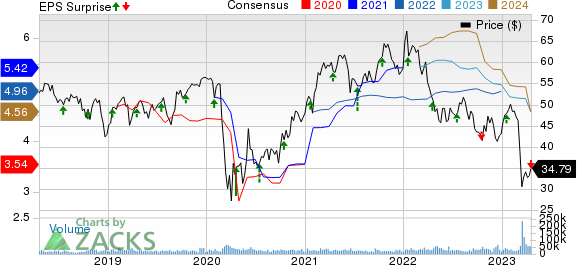
Truist Financial Corporation price-consensus-eps-surprise-chart | Truist Financial Corporation Quote
Truist Financial currently carries a Zacks Rank #4 (Sell).
You can see the complete list of today’s Zacks #1 Rank (Strong Buy) stocks here.
Performance of Other Major Banks
The PNC Financial Services Group, Inc.’s PNC first-quarter 2023 earnings per share of $3.98 surpassed the Zacks Consensus Estimate of $3.60 and improved 21% year over year. Per our estimate, the metric was $3.64 per share.
PNC’s results were aided by an increase in NII, supported by higher rates and loan growth. However, rising expenses and higher provisions were headwinds.
U.S. Bancorp’s USB first-quarter 2023 earnings per share (excluding merger and integration-related charges) of $1.16 handily beat the Zacks Consensus Estimate of $1.13 per share. It grew 17.2% from the prior-year quarter.
Results have benefited from an increase in NII, supported by higher interest rates. However, a decline in non-interest income (largely on lower mortgage banking income) and higher expenses were the headwinds. Also, USB’s credit quality deteriorated in the reported quarter.
Want the latest recommendations from Zacks Investment Research? Today, you can download 7 Best Stocks for the Next 30 Days. Click to get this free report
The PNC Financial Services Group, Inc (PNC) : Free Stock Analysis Report
U.S. Bancorp (USB) : Free Stock Analysis Report
Truist Financial Corporation (TFC) : Free Stock Analysis Report
