
 Yahoo Finance
 U.S. Dollar Index (DX) Futures Technical Analysis – Strong Euro, Lower US Rate Hike Expectations Capping Gains
The U.S. Dollar is trading flat against a basket of major currencies for the sixth straight session on Tuesday, putting traders on alert for the return of volatility. The catalyst today could be one of a number of U.S. economic reports ranging from the Goods Trade Balance at 12:30 GMT to the Conference Board’s Consumer Confidence at 14:00 GMT.
At 08:33 GMT, September U.S. Dollar Index futures are trading 103.700, up 0.022 or +0.02%. On Monday, the Invesco DB US Dollar Index Bullish Fund ETF (UUP) settled at $27.74, down $0.04 or -0.14%.
Helping to keep a lid on prices is a jump in Euro Zone government bond yields. The move is helping to boost the value of the Euro, which is a major component of the dollar index.
Traders are boosting the single-currency ahead of a speech by European Central Bank (ECB) president Christine Lagarde and more ECB speakers during the day. Investors are hoping the speakers offer more hints on how steep the monetary tightening path will be.
Although the greenback is still trading near its multi-year high at 105.79, it has been pulling back for nearly a week as financial market traders reduced peak rates from 4% to 3.5% for next year.
Daily Swing Chart Technical Analysis
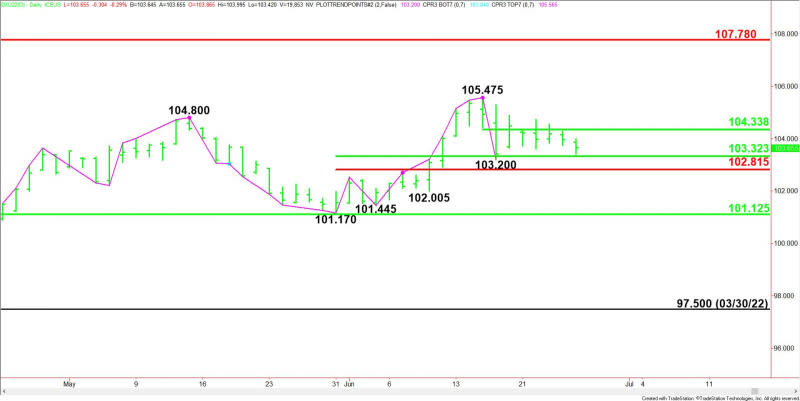
The main trend is up according to the daily swing chart. However, momentum has been trending lower since the formation of the closing price reversal top at 105.475 on June 15.
A trade through 105.475 will negate the closing price reversal top and signal a resumption of the uptrend. A move through the main bottoms at 101.445 and 101.170 will change the main trend to down.
The minor trend is also up. A trade through 102.005 will change the minor trend to down and confirm the shift in momentum.
The minor range is 105.475 to 103.200. Its pivot at 104.340 is resistance.
The short-term range is 101.170 to 105.475. Its downside target is the retracement zone at 103.320 to 102.815.
The main support is the long-term 50% level at 101.125.
Daily Swing Chart Technical Forecast
Trader reaction to the short-term 50% level at 103.325 is likely to determine the direction of the September U.S. Dollar Index on Tuesday.
Bullish Scenario
A sustained move over 103.325 will indicate the presence of buyers. If this creates enough upside momentum then look for a surge into the pivot at 104.340. Overtaking this level could trigger an acceleration into the main top at 105.475.
Bearish Scenario
A sustained move under 103.325 will signal the presence of sellers. Taking out the main bottom at 103.200 will indicate the selling pressure is getting stronger with 102.815 the next likely target. This is a potential trigger point for an acceleration into the minor bottom at 102.005, followed by a pair of main bottoms at 101.445 and 101.170. The major 50% level at 101.125 is also a potential downside target price.
Side Notes
Volume is extremely light ahead of the end of the quarter and next Monday’s U.S. holiday. Furthermore, traders are awaiting fresh U.S. data on Non-Farm Payrolls and Consumer Inflation. Additionally, there is still a major debate going on about whether the Fed should continue to lift rates aggressively, or dial it down a little in order to avoid a recession.
For a look at all of today’s economic events, check out our economic calendar.
This article was originally posted on FX Empire
