U.S. Dollar Index (DX) Futures Technical Analysis – Surge in Euro Could Drive Index into 94.670
The U.S. Dollar is trading lower against a basket of major currencies on Monday with the heavily-weighted Euro leading the way. The greenback is also under pressure against the British Pound and Canadian Dollars, while edging higher versus the safe-have Swiss Franc and Japanese Yen.
At 09:26 GMT, September U.S. Dollar Index futures are trading 95.790, down 0.099 or -0.10%.
The U.S. Dollar is being pressured after EU summit chairman Charles Michel said a recovery fund to revive economies hit by the COVID-19 pandemic could contain 390 billion Euros in grants.
EU leaders made progress toward an agreement over the weekend in Brussels after three days of talks, but they remain at odds over how to carve up the proposed 750 billion Euros ($858.98 billion) recovery fund designed to help Europe cope with its deepest recession since World War Two.
Traders also said the index was being pressured by renewed demand for risk after an early session setback in U.S. stock markets. This move was being fueled by expectations of more stimulus from Europe and also the United States.

Daily Swing Chart Technical Analysis
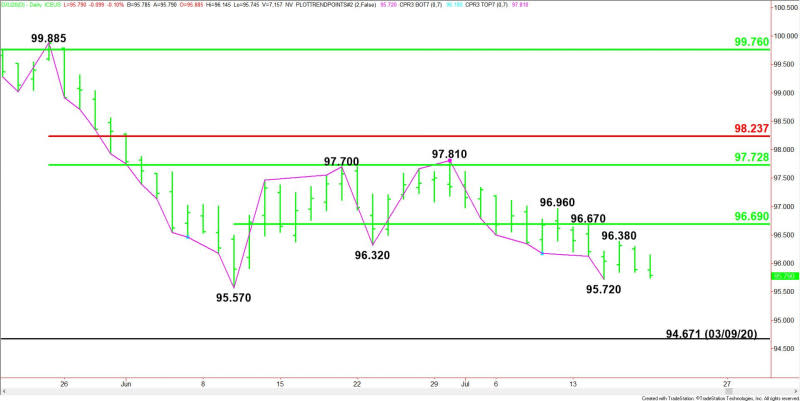
The main trend is down according to the daily swing chart. A trade through 95.720 will signal a resumption of the downtrend. Taking out the next main bottom at 95.570 will reaffirm the downtrend.
The main trend will change to up on a trade through 97.810. This is highly unlikely but due to the prolonged move down in terms of price and time, today’s session begins with the index inside the window of time for a potentially bullish closing price reversal bottom.
The minor trend is also down. A trade through 96.380 will change the minor trend to up. This will also shift momentum to the upside.
The short-term range is 95.570 to 97.810. Its 50% level at 96.690 is resistance.
Daily Swing Chart Technical Forecast
We’re going to be watching trader reaction to last week’s low at 95.72. Holding this level could trigger a short-covering rally, but it won’t mean much until buyers can take out the nearest minor top at 96.380.
If overtaking 96.380 can create enough upside momentum then this could set off buy stops over 96.67, 96.69 and 96.960.
A sustained move under 95.720 will indicate the selling pressure is getting stronger. This could lead to a test of the main bottom at 95.570. This is a potential trigger point for an acceleration into the March 9, 2020 bottom at 94.671.
Side Notes
Look for the movement in the Euro to dictate the price action in the September U.S. Dollar Index.
For a look at all of today’s economic events, check out our economic calendar.
This article was originally posted on FX Empire

 Yahoo Finance