
 Yahoo Finance
 We Like These Underlying Return On Capital Trends At Montrose Environmental Group (NYSE:MEG)
To find a multi-bagger stock, what are the underlying trends we should look for in a business? Ideally, a business will show two trends; firstly a growing return on capital employed (ROCE) and secondly, an increasing amount of capital employed. Ultimately, this demonstrates that it's a business that is reinvesting profits at increasing rates of return. Speaking of which, we noticed some great changes in Montrose Environmental Group's (NYSE:MEG) returns on capital, so let's have a look.
Return On Capital Employed (ROCE): What is it?
For those who don't know, ROCE is a measure of a company's yearly pre-tax profit (its return), relative to the capital employed in the business. Analysts use this formula to calculate it for Montrose Environmental Group:
Return on Capital Employed = Earnings Before Interest and Tax (EBIT) ÷ (Total Assets - Current Liabilities)
0.011 = US$7.9m ÷ (US$790m - US$100m) (Based on the trailing twelve months to March 2022).
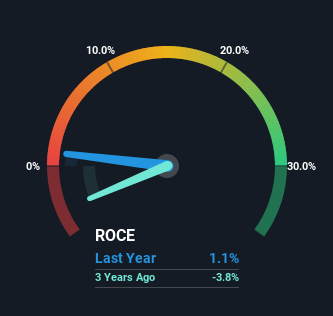
Thus, Montrose Environmental Group has an ROCE of 1.1%. In absolute terms, that's a low return and it also under-performs the Commercial Services industry average of 8.5%.
See our latest analysis for Montrose Environmental Group
In the above chart we have measured Montrose Environmental Group's prior ROCE against its prior performance, but the future is arguably more important. If you'd like to see what analysts are forecasting going forward, you should check out our free report for Montrose Environmental Group.
What The Trend Of ROCE Can Tell Us
We're delighted to see that Montrose Environmental Group is reaping rewards from its investments and is now generating some pre-tax profits. About three years ago the company was generating losses but things have turned around because it's now earning 1.1% on its capital. In addition to that, Montrose Environmental Group is employing 231% more capital than previously which is expected of a company that's trying to break into profitability. This can tell us that the company has plenty of reinvestment opportunities that are able to generate higher returns.
The Key Takeaway
Overall, Montrose Environmental Group gets a big tick from us thanks in most part to the fact that it is now profitable and is reinvesting in its business. Given the stock has declined 32% in the last year, this could be a good investment if the valuation and other metrics are also appealing. So researching this company further and determining whether or not these trends will continue seems justified.
Montrose Environmental Group does have some risks though, and we've spotted 2 warning signs for Montrose Environmental Group that you might be interested in.
While Montrose Environmental Group isn't earning the highest return, check out this free list of companies that are earning high returns on equity with solid balance sheets.
Have feedback on this article? Concerned about the content? Get in touch with us directly. Alternatively, email editorial-team (at) simplywallst.com.
This article by Simply Wall St is general in nature. We provide commentary based on historical data and analyst forecasts only using an unbiased methodology and our articles are not intended to be financial advice. It does not constitute a recommendation to buy or sell any stock, and does not take account of your objectives, or your financial situation. We aim to bring you long-term focused analysis driven by fundamental data. Note that our analysis may not factor in the latest price-sensitive company announcements or qualitative material. Simply Wall St has no position in any stocks mentioned.
