
 Yahoo Finance
 US Dollar Volatility Risk is High, Points to Larger Market Moves Ahead
DailyFX.com -
- Forex volatility prices drop considerably, suggest US Dollar to consolidate
- Continued moves in Commodity Bloc nonetheless Breakout2 trading system
- We look to the Momentum2 trading strategy in other USD pairs
The US Dollar is stuck in a tight range versus the Euro and other major counterparts. A pickup in short-term volatility suggests a breakout is possible in the week ahead.
The Dow Jones FXCM Dollar Index recently touched its highest levels in three months as the Greenback surged versus the Australian Dollar and other commodity-linked counterparts. Yet resilience in the Euro and the Japanese Yen has sparked a notable Dollar pullback to start the week’s trading. And indeed, the Euro/US Dollar exchange rate continues to trade in a very wide $1.08-$1.15 range since February; it may take a significant shift in market conditions to force a meaningful break.
A modest pickup in volatility prices suggests that the week ahead may see larger price swings than the last—particularly ahead of a highly-anticipated US Federal Open Market Committee meeting. A substantial Dollar breakout/breakdown is admittedly unlikely, but it will be important to watch for any surprises from the US central bank.
Forex Volatility Prices Rise Ahead of FOMC Meeting, Point to Stronger Price Moves

Data source: Bloomberg, DailyFX Calculations
Our strategy bias remains on the Breakout2 strategy in certain commodity-linked USD pairs, while the potential for trend shifts in the Euro/US Dollar suggests the Momentum2 system could do well.
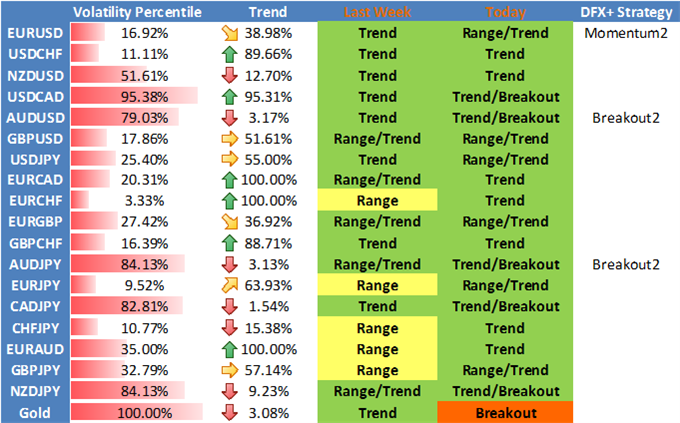
See the table below for full detail on market conditions and preferred trading strategies.
DailyFX Individual Currency Pair Conditions and Trading Strategy Bias
Understand the Breakout2 Trading System via our previous article
Auto trade the trend reversal-trading Momentum2system via our previous article.
Trade with strong trends via our Momentum1 Trading System
Use our counter-trend Range2 Trading system
--- Written by David Rodriguez, Quantitative Strategist for DailyFX.com
To receive the Speculative Sentiment Index and other reports from this author via e-mail, sign up to David’s e-mail distribution list via this link.
Contact David via Twitter at http://www.twitter.com/DRodriguezFX
Definitions
Volatility Percentile – The higher the number, the more likely we are to see strong movements in price. This number tells us where current implied volatility levels stand in relation to the past 90 days of trading. We have found that implied volatilities tend to remain very high or very low for extended periods of time. As such, it is helpful to know where the current implied volatility level stands in relation to its medium-term range.
Trend – This indicator measures trend intensity by telling us where price stands in relation to its 90 trading-day range. A very low number tells us that price is currently at or near 90-day lows, while a higher number tells us that we are near the highs. A value at or near 50 percent tells us that we are at the middle of the currency pair’s 90-day range.
Range High – 90-day closing high.
Range Low – 90-day closing low.
Last – Current market price.
Bias – Based on the above criteria, we assign the more likely profitable strategy for any given currency pair. A highly volatile currency pair (Volatility Percentile very high) suggests that we should look to use Breakout strategies. More moderate volatility levels and strong Trend values make Momentum trades more attractive, while the lowest Vol Percentile and Trend indicator figures make Range Trading the more attractive strategy.
HYPOTHETICAL PERFORMANCE RESULTS HAVE MANY INHERENT LIMITATIONS, SOME OF WHICH ARE DESCRIBED BELOW. NO REPRESENTATION IS BEING MADE THAT ANY ACCOUNT WILL OR IS LIKELY TO ACHIEVE PROFITS OR LOSSES SIMILAR TO THOSE SHOWN. IN FACT, THERE ARE FREQUENTLY SHARP DIFFERENCES BETWEEN HYPOTHETICAL PERFORMANCE RESULTS AND THE ACTUAL RESULTS SUBSEQUENTLY ACHIEVED BY ANY PARTICULAR TRADING PROGRAM.
ONE OF THE LIMITATIONS OF HYPOTHETICAL PERFORMANCE RESULTS IS THAT THEY ARE GENERALLY PREPARED WITH THE BENEFIT OF HINDSIGHT. IN ADDITION, HYPOTHETICAL TRADING DOES NOT INVOLVE FINANCIAL RISK, AND NO HYPOTHETICAL TRADING RECORD CAN COMPLETELY ACCOUNT FOR THE IMPACT OF FINANCIAL RISK IN ACTUAL TRADING. FOR EXAMPLE, THE ABILITY TO WITHSTAND LOSSES OR TO ADHERE TO A PARTICULAR TRADING PROGRAM IN SPITE OF TRADING LOSSES IS MATERIAL POINTS WHICH CAN ALSO ADVERSELY AFFECT ACTUAL TRADING RESULTS. THERE ARE NUMEROUS OTHER FACTORS RELATED TO THE MARKETS IN GENERAL OR TO THE IMPLEMENTATION.
OF ANY SPECIFIC TRADING PROGRAM WHICH CANNOT BE FULLY ACCOUNTED FOR IN THE PREPARATION OF HYPOTHETICAL PERFORMANCE RESULTS AND ALL OF WHICH CAN ADVERSELY AFFECT ACTUAL TRADING RESULTS.
Any opinions, news, research, analyses, prices, or other information contained on this website is provided as general market commentary, and does not constitute investment advice. The FXCM group will not accept liability for any loss or damage, including without limitation to, any loss of profit, which may arise directly or indirectly from use of or reliance contained in the trading signals, or in any accompanying chart analyses.
DailyFX provides forex news and technical analysis on the trends that influence the global currency markets.
Learn forex trading with a free practice account and trading charts from FXCM.
