USD/JPY Candlestick Analysis: A Top in Place Below 122.00?
DailyFX.com -
To receive Ilya's analysis directly via email, please SIGN UP HERE
Talking Points:
USD/JPY Strategy: Flat
Chart Setup Hints at Topping Sub-122.00
Pullback to Yield Long Trade Opportunity
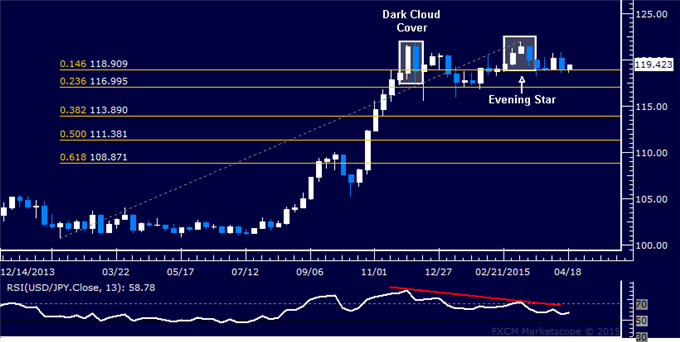
The US Dollar looks to be forming a top against the Japanese Yen marked by bearish Dark Cloud Cover and Evening Star candlestick patterns. Negative RSI divergence bolsters the case for a downside scenario. A break below the 14.6% Fibonacci retracement at 118.91 exposes the 23.6% level at 117.00. Near-term resistance is at 122.01, the March swing top.
The overall USDJPY trend continues to favor the upside. With that in mind, we will look to any on-coming losses as an opportunity to enter long at more attractive levels once the downswing is exhausted.
Add these technical levels directly to your charts with our Support/Resistance Wizard app!

Weekly Chart - Created Using FXCM Marketscope
--- Written by Ilya Spivak, Currency Strategist for DailyFX.com
DailyFX provides forex news and technical analysis on the trends that influence the global currency markets.
Learn forex trading with a free practice account and trading charts from FXCM.

 Yahoo Finance
