
 Yahoo Finance
 USD/JPY Technical Analysis – Resistance Sub-103.00 at Risk
To receive Ilya's analysis directly via email, please SIGN UP HERE
Talking Points:
USD/JPY Technical Strategy: Flat
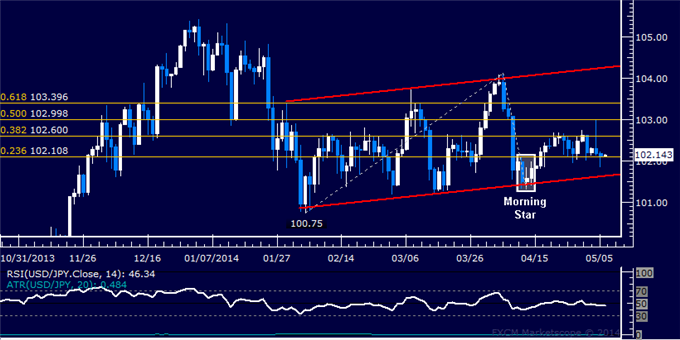
Support: 102.11 (23.6% Fib exp.), 101.53 (channel floor)
Resistance: 102.60 (38.2% Fib exp.), 103.00 (50% Fib exp.)
The US Dollar continues edge upward against the Japanese Yen after turned higher as expected having produced a bullish Morning Star candlestick pattern. Prices are probing above the 38.2% Fibonacci expansion at 102.60, with a break above this barrier on a daily closing basis targeting the 50% level at 103.00. Alternatively, a reversal back beneath the 38.2% Fib at 102.11 aims for the bottom of a rising channel set from early February, now at 101.54.
Prices are too close to relevant resistance to justify a long position from a risk/reward perspective. We will remain flat for the time being, waiting for a more attractive setup to present itself.
Confirm your chart-based trade setups with the Technical Analyzer. New to FX? Start Here!
Daily Chart - Created Using FXCM Marketscope 2.0
--- Written by Ilya Spivak, Currency Strategist for DailyFX.com
DailyFX provides forex news and technical analysis on the trends that influence the global currency markets.
Learn forex trading with a free practice account and trading charts from FXCM.
