
 Yahoo Finance
 USDCAD pushes lower without any hestitation
Sometimes you can hear people saying: ‘another day, another dollar’ when referring to their work duties and approach etc. On the market, we could be saying now: ‘another day, weaker dollar’. USD is recently losing ground and the beginning of the new week does not look much different. Real troubles started here in the middle of December and since that, the USDCAD made three bearish weekly candles, one small bullish correction and we start again with a significant drop, drawing a black body.
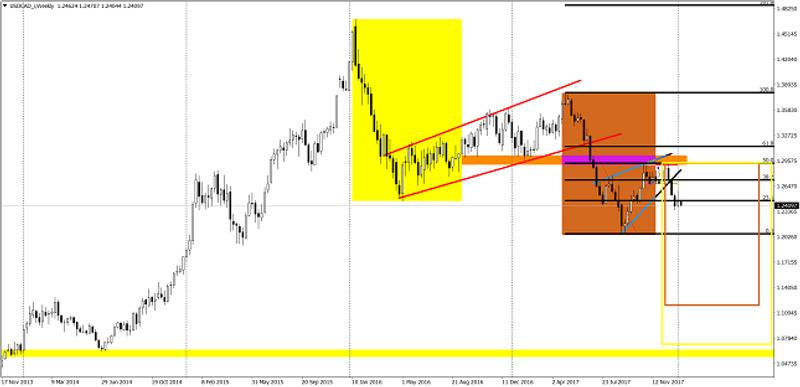
The bearish approach here is justified by many factors. As the main one, I would mention the general downtrend and the fact that we bounced from the 50% Fibonacci retracement of the latest downswing. What is more, the price created two nice patterns, both of them resulting in a drop – a flag (red) and a wedge (blue). Sell signal is fully on so let’s think where we can look for a potential target here. As you can see, we measured two main bearish impulses. One from the first half of 2016 and one from the middle of 2017. One was around 2200 pips (yellow) and the second one around 1700 pips (orange). History likes to repeat itself and very often main impulses or corrections have the same amount of pips. That is why we are expecting that the drop will be somewhere between 1700 and 2200 pips. The second option looks more tempting as we would reach the lows from the 2014 and highs from 2013, so a very strong technical support.
The sentiment here is definitely negative and the technical analysis is currently promoting a strong long-term sell signal here. This approach will be denied, once the price will come back above the 50% Fibo which for now, is less likely to happen.
This article is written by Tomasz Wisniewski, a senior analyst at Alpari Research & Analysis
This article was originally posted on FX Empire
