
 Yahoo Finance
 VAALCO Energy, Inc. (NYSE:EGY) Looks Inexpensive But Perhaps Not Attractive Enough
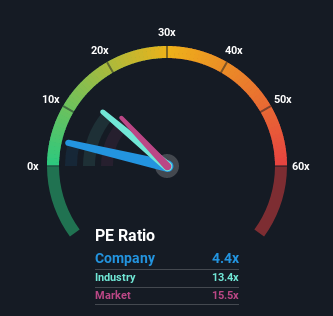
When close to half the companies in the United States have price-to-earnings ratios (or "P/E's") above 16x, you may consider VAALCO Energy, Inc. (NYSE:EGY) as a highly attractive investment with its 4.4x P/E ratio. However, the P/E might be quite low for a reason and it requires further investigation to determine if it's justified.
With earnings growth that's exceedingly strong of late, VAALCO Energy has been doing very well. One possibility is that the P/E is low because investors think this strong earnings growth might actually underperform the broader market in the near future. If that doesn't eventuate, then existing shareholders have reason to be quite optimistic about the future direction of the share price.
Check out our latest analysis for VAALCO Energy
Want the full picture on earnings, revenue and cash flow for the company? Then our free report on VAALCO Energy will help you shine a light on its historical performance.
Is There Any Growth For VAALCO Energy?
The only time you'd be truly comfortable seeing a P/E as depressed as VAALCO Energy's is when the company's growth is on track to lag the market decidedly.
If we review the last year of earnings growth, the company posted a terrific increase of 460%. Still, incredibly EPS has fallen 6.7% in total from three years ago, which is quite disappointing. Accordingly, shareholders would have felt downbeat about the medium-term rates of earnings growth.
Weighing that medium-term earnings trajectory against the broader market's one-year forecast for expansion of 10% shows it's an unpleasant look.
With this information, we are not surprised that VAALCO Energy is trading at a P/E lower than the market. However, we think shrinking earnings are unlikely to lead to a stable P/E over the longer term, which could set up shareholders for future disappointment. Even just maintaining these prices could be difficult to achieve as recent earnings trends are already weighing down the shares.
The Bottom Line On VAALCO Energy's P/E
Using the price-to-earnings ratio alone to determine if you should sell your stock isn't sensible, however it can be a practical guide to the company's future prospects.
We've established that VAALCO Energy maintains its low P/E on the weakness of its sliding earnings over the medium-term, as expected. At this stage investors feel the potential for an improvement in earnings isn't great enough to justify a higher P/E ratio. If recent medium-term earnings trends continue, it's hard to see the share price moving strongly in either direction in the near future under these circumstances.
And what about other risks? Every company has them, and we've spotted 5 warning signs for VAALCO Energy (of which 2 can't be ignored!) you should know about.
You might be able to find a better investment than VAALCO Energy. If you want a selection of possible candidates, check out this free list of interesting companies that trade on a P/E below 20x (but have proven they can grow earnings).
Have feedback on this article? Concerned about the content? Get in touch with us directly. Alternatively, email editorial-team (at) simplywallst.com.
This article by Simply Wall St is general in nature. We provide commentary based on historical data and analyst forecasts only using an unbiased methodology and our articles are not intended to be financial advice. It does not constitute a recommendation to buy or sell any stock, and does not take account of your objectives, or your financial situation. We aim to bring you long-term focused analysis driven by fundamental data. Note that our analysis may not factor in the latest price-sensitive company announcements or qualitative material. Simply Wall St has no position in any stocks mentioned.
