
 Yahoo Finance
 Virgin Wines UK (LON:VINO) Is Very Good At Capital Allocation
Finding a business that has the potential to grow substantially is not easy, but it is possible if we look at a few key financial metrics. Amongst other things, we'll want to see two things; firstly, a growing return on capital employed (ROCE) and secondly, an expansion in the company's amount of capital employed. Ultimately, this demonstrates that it's a business that is reinvesting profits at increasing rates of return. Speaking of which, we noticed some great changes in Virgin Wines UK's (LON:VINO) returns on capital, so let's have a look.
Understanding Return On Capital Employed (ROCE)
For those who don't know, ROCE is a measure of a company's yearly pre-tax profit (its return), relative to the capital employed in the business. Analysts use this formula to calculate it for Virgin Wines UK:
Return on Capital Employed = Earnings Before Interest and Tax (EBIT) ÷ (Total Assets - Current Liabilities)
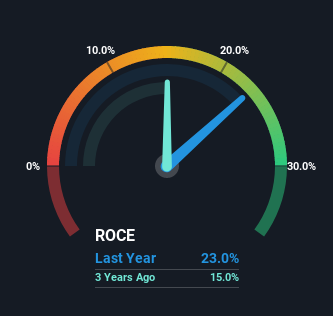
0.23 = UK£5.3m ÷ (UK£45m - UK£22m) (Based on the trailing twelve months to December 2021).
Therefore, Virgin Wines UK has an ROCE of 23%. That's a fantastic return and not only that, it outpaces the average of 9.8% earned by companies in a similar industry.
See our latest analysis for Virgin Wines UK
Above you can see how the current ROCE for Virgin Wines UK compares to its prior returns on capital, but there's only so much you can tell from the past. If you're interested, you can view the analysts predictions in our free report on analyst forecasts for the company.
How Are Returns Trending?
The trends we've noticed at Virgin Wines UK are quite reassuring. Over the last five years, returns on capital employed have risen substantially to 23%. Basically the business is earning more per dollar of capital invested and in addition to that, 58% more capital is being employed now too. So we're very much inspired by what we're seeing at Virgin Wines UK thanks to its ability to profitably reinvest capital.
For the record though, there was a noticeable increase in the company's current liabilities over the period, so we would attribute some of the ROCE growth to that. Essentially the business now has suppliers or short-term creditors funding about 49% of its operations, which isn't ideal. Given it's pretty high ratio, we'd remind investors that having current liabilities at those levels can bring about some risks in certain businesses.
Our Take On Virgin Wines UK's ROCE
To sum it up, Virgin Wines UK has proven it can reinvest in the business and generate higher returns on that capital employed, which is terrific. Astute investors may have an opportunity here because the stock has declined 69% in the last year. That being the case, research into the company's current valuation metrics and future prospects seems fitting.
Like most companies, Virgin Wines UK does come with some risks, and we've found 1 warning sign that you should be aware of.
If you want to search for more stocks that have been earning high returns, check out this free list of stocks with solid balance sheets that are also earning high returns on equity.
Have feedback on this article? Concerned about the content? Get in touch with us directly. Alternatively, email editorial-team (at) simplywallst.com.
This article by Simply Wall St is general in nature. We provide commentary based on historical data and analyst forecasts only using an unbiased methodology and our articles are not intended to be financial advice. It does not constitute a recommendation to buy or sell any stock, and does not take account of your objectives, or your financial situation. We aim to bring you long-term focused analysis driven by fundamental data. Note that our analysis may not factor in the latest price-sensitive company announcements or qualitative material. Simply Wall St has no position in any stocks mentioned.
Join A Paid User Research Session
You’ll receive a US$30 Amazon Gift card for 1 hour of your time while helping us build better investing tools for the individual investors like yourself. Sign up here
