
 Yahoo Finance
 Vista Group International Limited (NZSE:VGL) Investors Are Less Pessimistic Than Expected

Want to participate in a short research study? Help shape the future of investing tools and earn a $40 gift card!
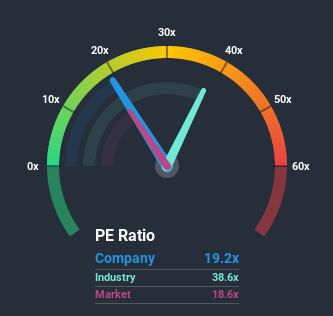
With a median price-to-earnings (or "P/E") ratio of close to 19x in New Zealand, you could be forgiven for feeling indifferent about Vista Group International Limited's (NZSE:VGL) P/E ratio of 19.2x. While this might not raise any eyebrows, if the P/E ratio is not justified investors could be missing out on a potential opportunity or ignoring looming disappointment.
Vista Group International has been struggling lately as its earnings have declined faster than most other companies. It might be that many expect the dismal earnings performance to revert back to market averages soon, which has kept the P/E from falling. You'd much rather the company wasn't bleeding earnings if you still believe in the business. Or at the very least, you'd be hoping it doesn't keep underperforming if your plan is to pick up some stock while it's not in favour.
View our latest analysis for Vista Group International
How Does Vista Group International's P/E Ratio Compare To Its Industry Peers?
We'd like to see if P/E's within Vista Group International's industry might provide some colour around the company's fairly average P/E ratio. You'll notice in the figure below that P/E ratios in the Software industry are significantly higher than the market. So unfortunately this doesn't provide much to explain the company's ratio at all right now. Ordinarily, the majority of companies' P/E's would be lifted firmly by the general conditions within the Software industry. Still, the strength of the company's earnings will most likely determine where its P/E shall sit.
Want the full picture on analyst estimates for the company? Then our free report on Vista Group International will help you uncover what's on the horizon.
What Are Growth Metrics Telling Us About The P/E?
There's an inherent assumption that a company should be matching the market for P/E ratios like Vista Group International's to be considered reasonable.
Taking a look back first, the company's earnings per share growth last year wasn't something to get excited about as it posted a disappointing decline of 13%. This means it has also seen a slide in earnings over the longer-term as EPS is down 79% in total over the last three years. Accordingly, shareholders would have felt downbeat about the medium-term rates of earnings growth.
Turning to the outlook, the next three years should bring diminished returns, with earnings decreasing 5.8% each year as estimated by the three analysts watching the company. That's not great when the rest of the market is expected to grow by 7.7% per year.
With this information, we find it concerning that Vista Group International is trading at a fairly similar P/E to the market. Apparently many investors in the company reject the analyst cohort's pessimism and aren't willing to let go of their stock right now. There's a good chance these shareholders are setting themselves up for future disappointment if the P/E falls to levels more in line with the negative growth outlook.
The Bottom Line On Vista Group International's P/E
Using the price-to-earnings ratio alone to determine if you should sell your stock isn't sensible, however it can be a practical guide to the company's future prospects.
Our examination of Vista Group International's analyst forecasts revealed that its outlook for shrinking earnings isn't impacting its P/E as much as we would have predicted. When we see a poor outlook with earnings heading backwards, we suspect share price is at risk of declining, sending the moderate P/E lower. Unless these conditions improve, it's challenging to accept these prices as being reasonable.
You should always think about risks. Case in point, we've spotted 2 warning signs for Vista Group International you should be aware of.
If these risks are making you reconsider your opinion on Vista Group International, explore our interactive list of high quality stocks to get an idea of what else is out there.
This article by Simply Wall St is general in nature. It does not constitute a recommendation to buy or sell any stock, and does not take account of your objectives, or your financial situation. We aim to bring you long-term focused analysis driven by fundamental data. Note that our analysis may not factor in the latest price-sensitive company announcements or qualitative material. Simply Wall St has no position in any stocks mentioned.
Have feedback on this article? Concerned about the content? Get in touch with us directly. Alternatively, email editorial-team@simplywallst.com.
