
 Yahoo Finance
 Will Vista Group International Limited's (NZSE:VGL) Earnings Grow In The Next Couple Of Years?

Want to participate in a short research study? Help shape the future of investing tools and you could win a $250 gift card!
Vista Group International Limited's (NZSE:VGL) most recent earnings update in December 2018 indicated that the business benefited from a robust tailwind, leading to a double-digit earnings growth of 27%. Below, I've laid out key growth figures on how market analysts view Vista Group International's earnings growth outlook over the next couple of years and whether the future looks even brighter than the past. Note that I will be looking at net income excluding extraordinary items to get a better understanding of the underlying drivers of earnings.
View our latest analysis for Vista Group International
Analysts' expectations for next year seems optimistic, with earnings climbing by a significant 72%. This strong growth in earnings is expected to continue, bringing the bottom line up to NZ$34m by 2022.
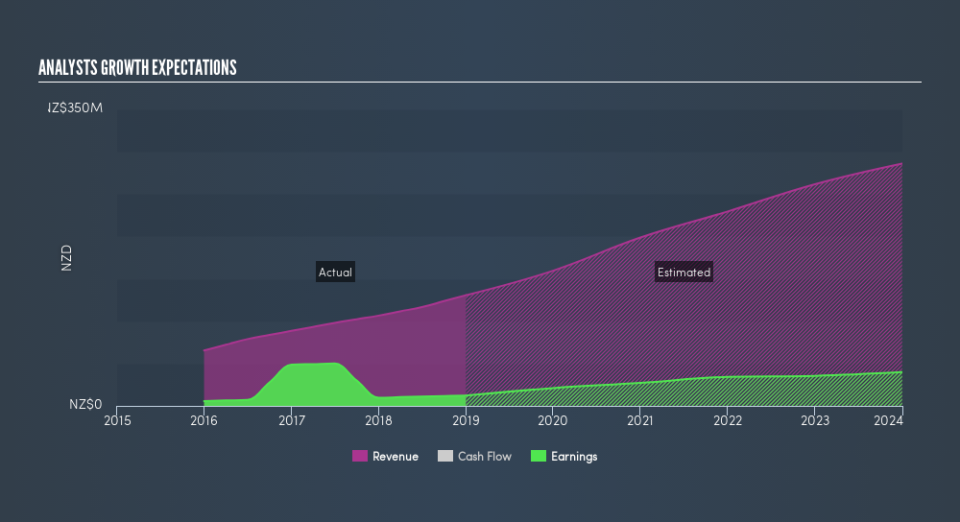
Even though it is useful to be aware of the growth rate each year relative to today’s value, it may be more insightful analyzing the rate at which the company is rising or falling every year, on average. The benefit of this method is that we can get a bigger picture of the direction of Vista Group International's earnings trajectory over the long run, irrespective of near term fluctuations, which may be more relevant for long term investors. To calculate this rate, I put a line of best fit through the forecasted earnings by market analysts. The slope of this line is the rate of earnings growth, which in this case is 22%. This means that, we can anticipate Vista Group International will grow its earnings by 22% every year for the next few years.
Next Steps:
For Vista Group International, I've put together three relevant factors you should further examine:
Financial Health: Does it have a healthy balance sheet? Take a look at our free balance sheet analysis with six simple checks on key factors like leverage and risk.
Valuation: What is VGL worth today? Is the stock undervalued, even when its growth outlook is factored into its intrinsic value? The intrinsic value infographic in our free research report helps visualize whether VGL is currently mispriced by the market.
Other High-Growth Alternatives: Are there other high-growth stocks you could be holding instead of VGL? Explore our interactive list of stocks with large growth potential to get an idea of what else is out there you may be missing!
We aim to bring you long-term focused research analysis driven by fundamental data. Note that our analysis may not factor in the latest price-sensitive company announcements or qualitative material.
If you spot an error that warrants correction, please contact the editor at editorial-team@simplywallst.com. This article by Simply Wall St is general in nature. It does not constitute a recommendation to buy or sell any stock, and does not take account of your objectives, or your financial situation. Simply Wall St has no position in the stocks mentioned. Thank you for reading.
